It seems like a lot of folks have a bone to pick with Rep. Joe Manchin [D-WV] who has just this week single-handedly “torpedoed” the Build Back Better bill. The BBB could have been the “the most significant climate legislation in US history,” Megan Mahajan, the manager of energy policy design at the think tank Energy Innovation, told PopSci in October. The plan would put billions of money into developing low-carbon energy technologies and building a national network for electric vehicles.
When this bill dies, so do the chances for the country to reach its lofty and aggressive climate change goals. “There’s still a yawning gap between where we are today and where we need to be to hit President Biden’s climate targets,” Jesse Jenkins, an energy systems engineer at Princeton University who has led an effort to model the effects of the bill on US-wide emissions, told the New York Times. “Without either this bill or a climate bill that’s similar in scope, it’s really hard to see how those goals will be met.”
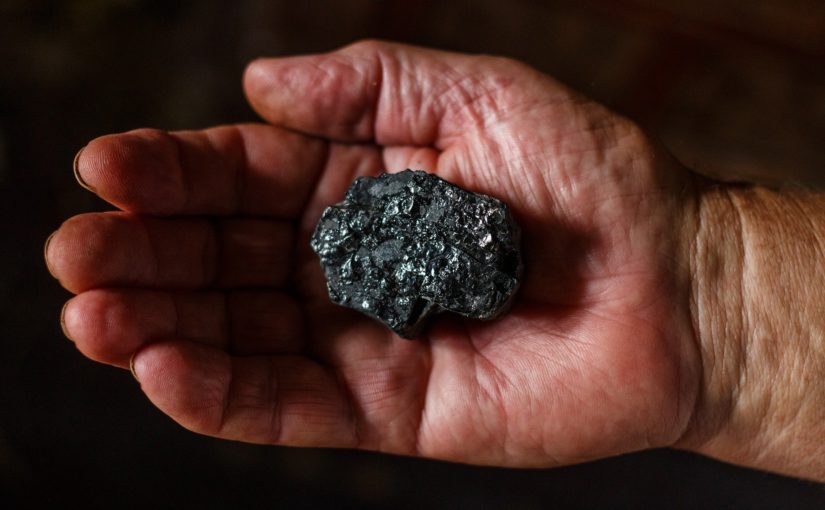
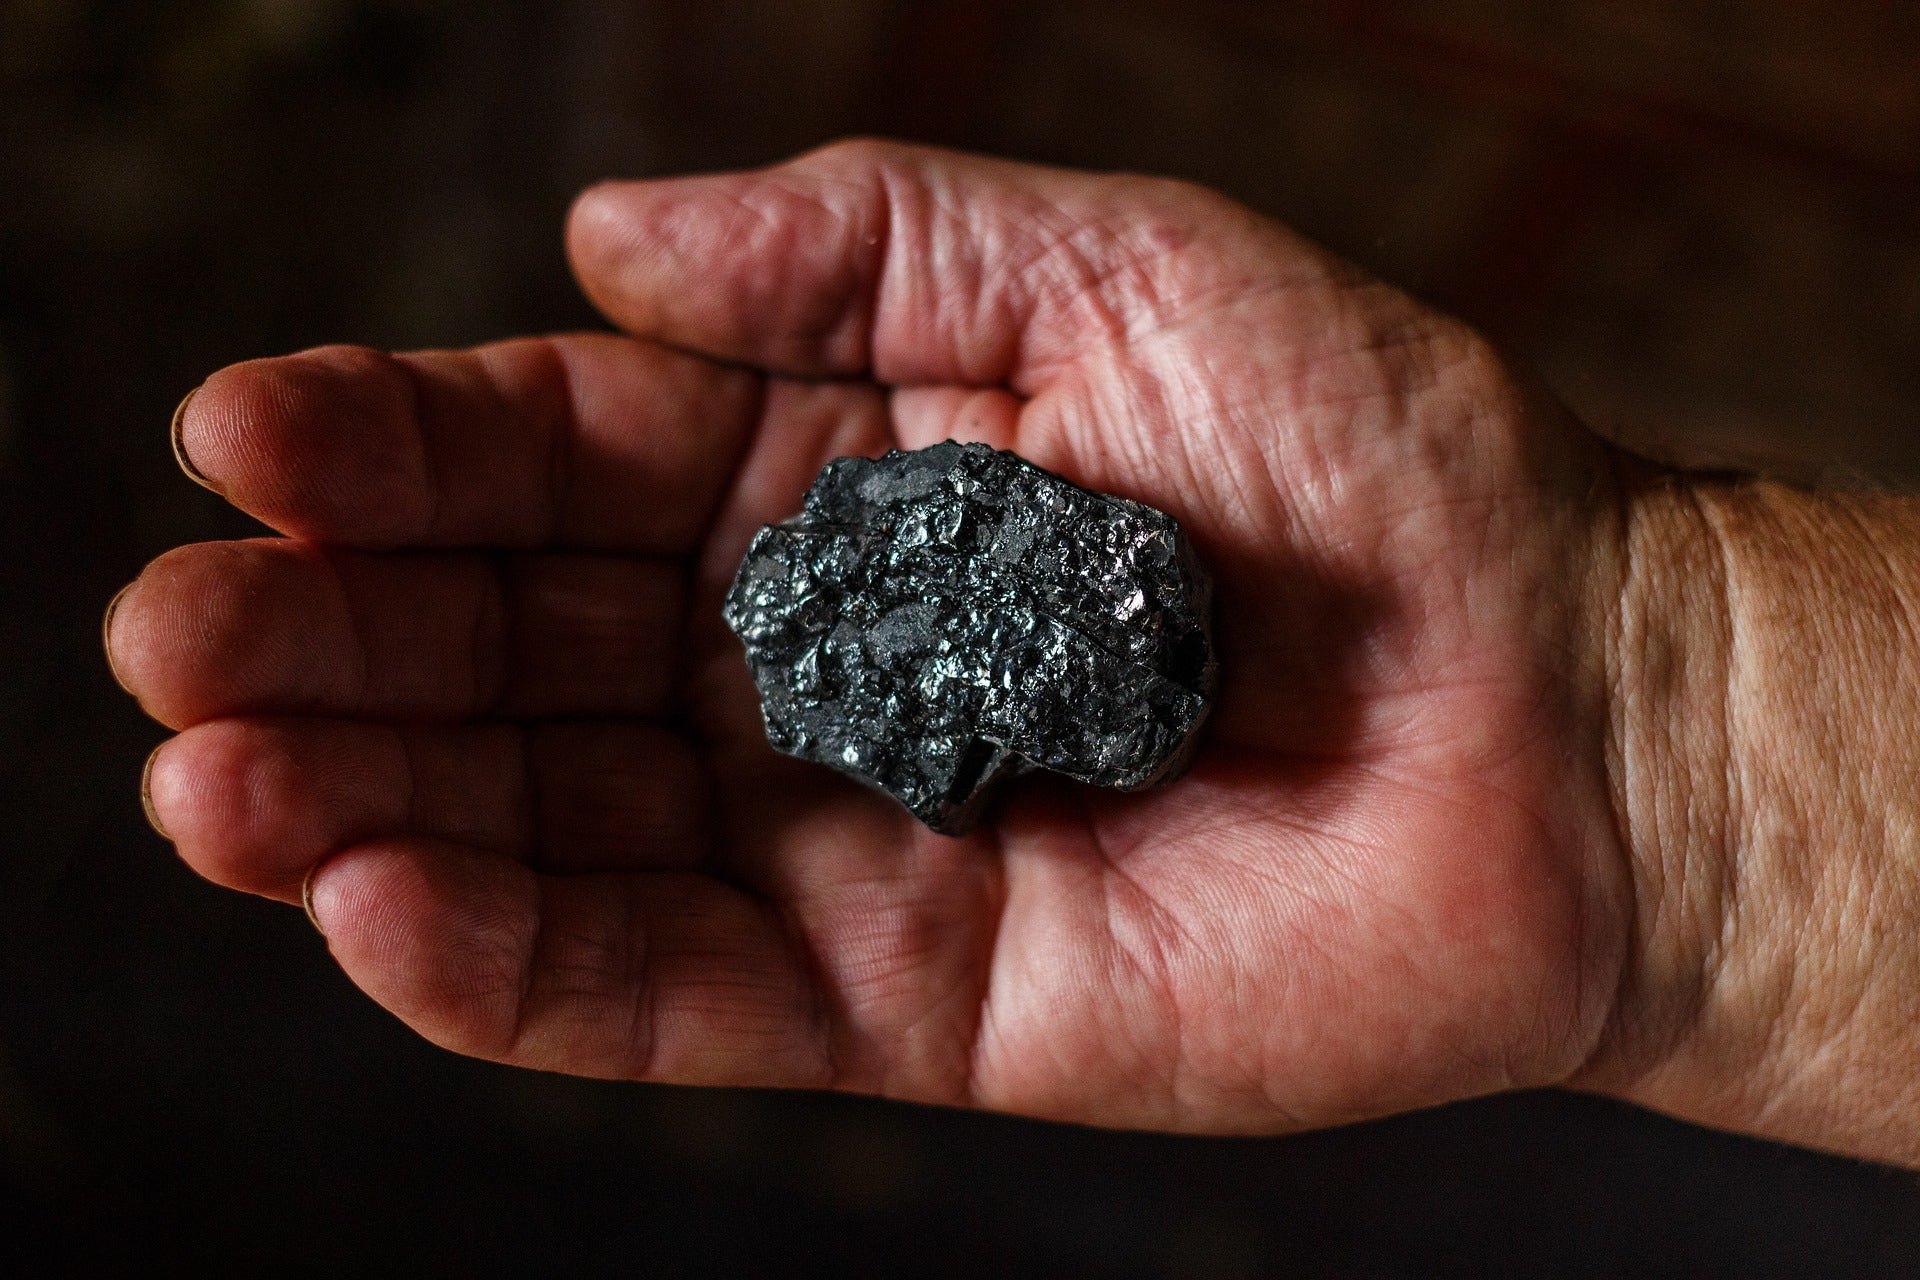
Unsurprisingly, left-leaning members of the Democratic party and the president himself have voiced frustration with Manchin’s choice. But a more surprising group is speaking out against Manchin’s decision, too—coal miners, including some he represents.
The BBB, along with all of its proposed clean energy benefits, provides a significant boost to coal workers by extending fees paid by coal companies to fund treatments and benefits of workers suffering pneumoconiosis, or Black Lung, which affects thousands of miners across the country. According to the statement, without BBB, that fee will be chopped in half and put the burden of healthcare payments back on individuals and taxpayers. Further, the bill provides tax incentives for companies to build new business on coalfields to employ out-of-work miners.
Additionally, the BBB provides language that would help workers unionize. “This language is critical to any long-term ability to restore the right to organize in America in the face of ramped-up union-busting by employers,” Cecil Roberts, the union’s president, said in a statement. “But now there is no path forward for millions of workers to exercise their rights at work.”
UMWA already released a plan for the energy transition earlier this year stating that “change is coming, whether we seek it or not.” The coal industry saw employment losses of around 50 percent between 2011 and 2020, which will likely continue as the country moves toward a cleaner energy mix. Proposals that include supporting miners and their families by incentivizing alternative jobs in coal country are crucial in protecting these already vulnerable communities.
“We’re likely to lose coal jobs whether or not this bill passes,” Phil Smith, the chief lobbyist for UMWA, told the Washington Post. “If that’s the case, let’s figure out a way to provide as many jobs as possible for those who are going to lose.”
For GREAT deals on a new or used Toyota check out Toyota of Escondido TODAY!
On Wednesday morning, the FDA issued the first emergency use authorization for a COVID treatment pill. In a phase III trial, Pfizer’s Pavloxvid was 89 percent effective at stopping high-risk COVID patients from becoming severely ill.
The treatment could keep people out of the hospital during the Omicron wave, reducing strain on a crumbling healthcare system. But shortages, both of Paxlovid itself and of COVID tests, could limit its impact during crucial weeks.
Unlike Molnupiravir, Paxlovid works by inhibiting a crucial protein on SARS-CoV-2 particles. One of the ingredients can interact with other drugs, and it isn’t recommended for people with severe kidney or liver problems, but it doesn’t carry the same poorly-understood risks.
Both Paxlovid and Molnupiravir are given as a five-day series of various pills, and must be started within five days of symptom onset. In the phase III trial, which was conducted on people with conditions that put them at high risk for severe COVID, only .8 percent of those who received Paxlovid were hospitalized or died—versus six percent of those who took a placebo. In the Molnupiravir trial, 6.8 percent of the treated patients were hospitalized or died within a 29 day time period compared to 9.7 percent who received a placebo.
Who will get the COVID pill?
For the moment, Paxlovid will only be available by prescription to people over the age of 12 with a high risk of developing severe COVID. Molnupiravir will be available by prescription to adults 18 and older with COVID-19 risk factors. Those qualifying existing conditions are described by the CDC, and include immunocompromising diseases, smoking, and heart disease, among others.
For now, the FDA has not specified whether vaccinated individuals who meet the criteria above will be eligible, which means physicians will likely make their own calls.
How big of a deal is the COVID pill?
When Paxlovid was first developed, it was promising largely because a pill is much easier to deliver than existing COVID treatments, like monoclonal antibodies, which are given intravenously in a hospital. But Omicron has made several of those antibody treatments less effective, leaving providers with an incoming rush of cases and less certainty about how to address them.
Paxlovid and Molnupiravir can be prescribed for use at home, but the catch is that they must be taken within a few days of symptom onset. With hours-long lines for PCR testing in many Omicron hotspots and a shortage of at-home rapid tests, getting diagnosed in time for the treatments to make a difference could prove challenging.
But even if you’re eligible and manage to get a quick diagnosis, you still might not have a course of COVID pills in your future. Pfizer representatives recently told the Washington Post that the company expects to manufacture enough of the drug to treat 180,000 patients by the end of 2021. The Biden administration is expected to buy 3 million courses of Merck’s drug by the end of January.
Last January, the US peaked at about 250,000 new COVID cases per day. US health officials expect Omicron, which appears to be much more transmissible than other variants, to beat that record. Many of those cases will be mild. But with so many unknowns about the risk of long-haul symptoms, the CDC may need to develop firmer guidelines to determine who receives these treatments.
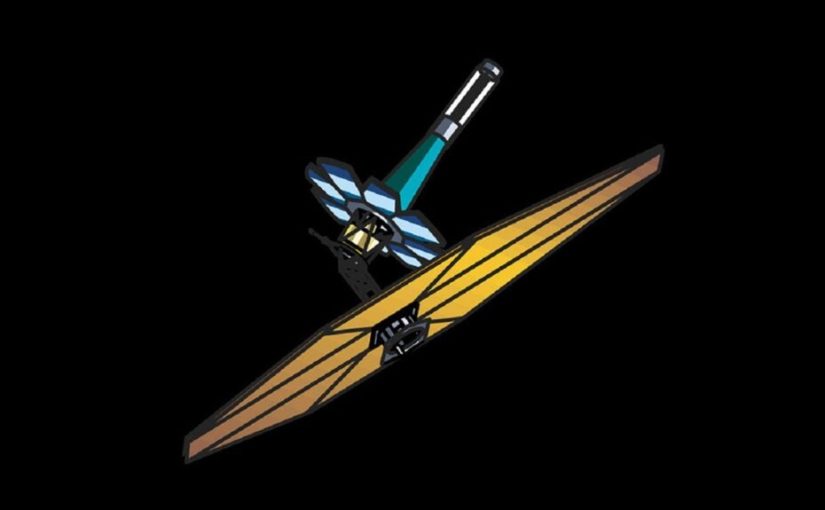
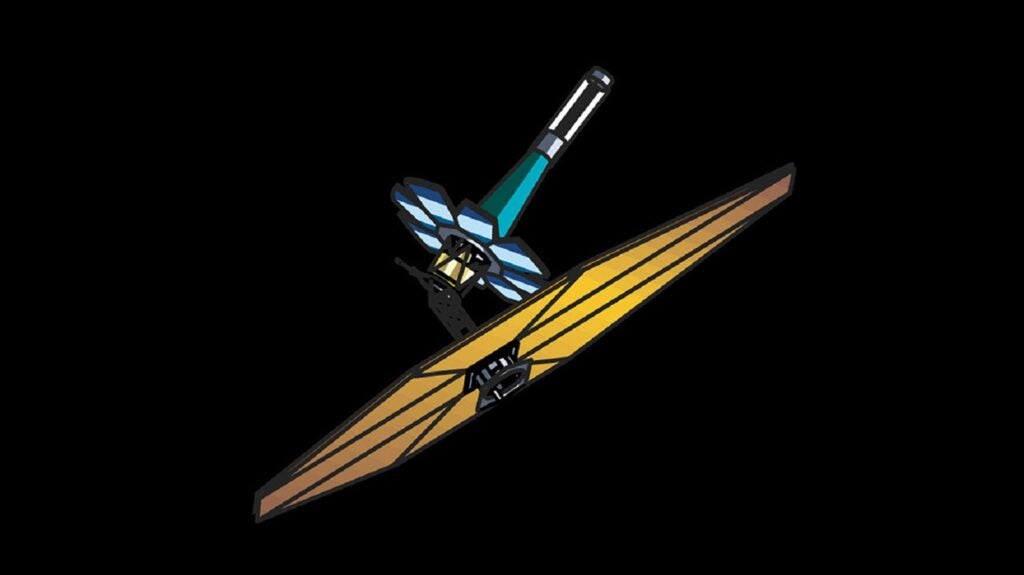
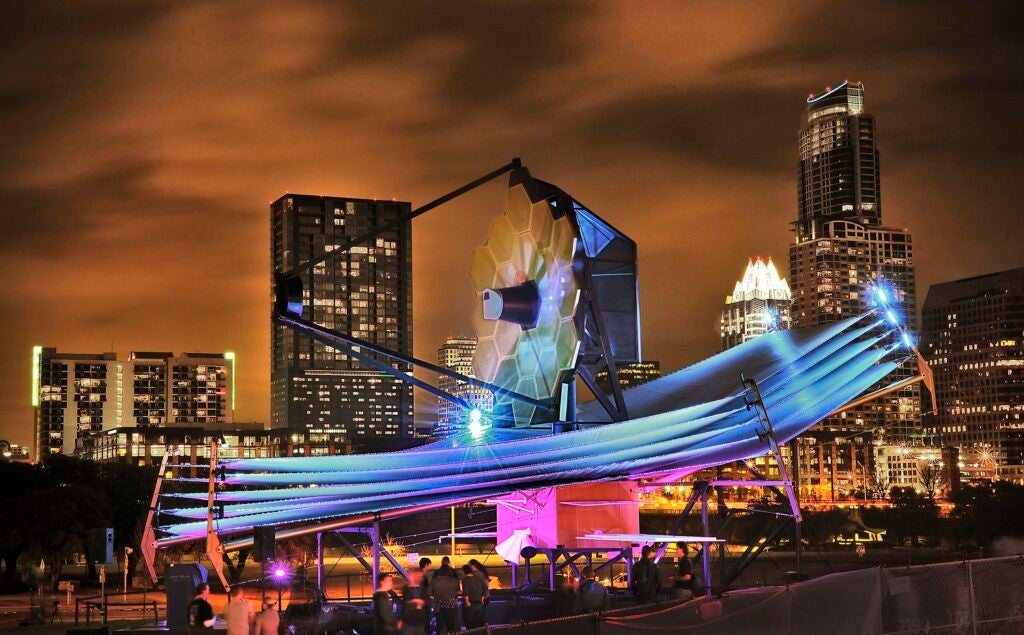
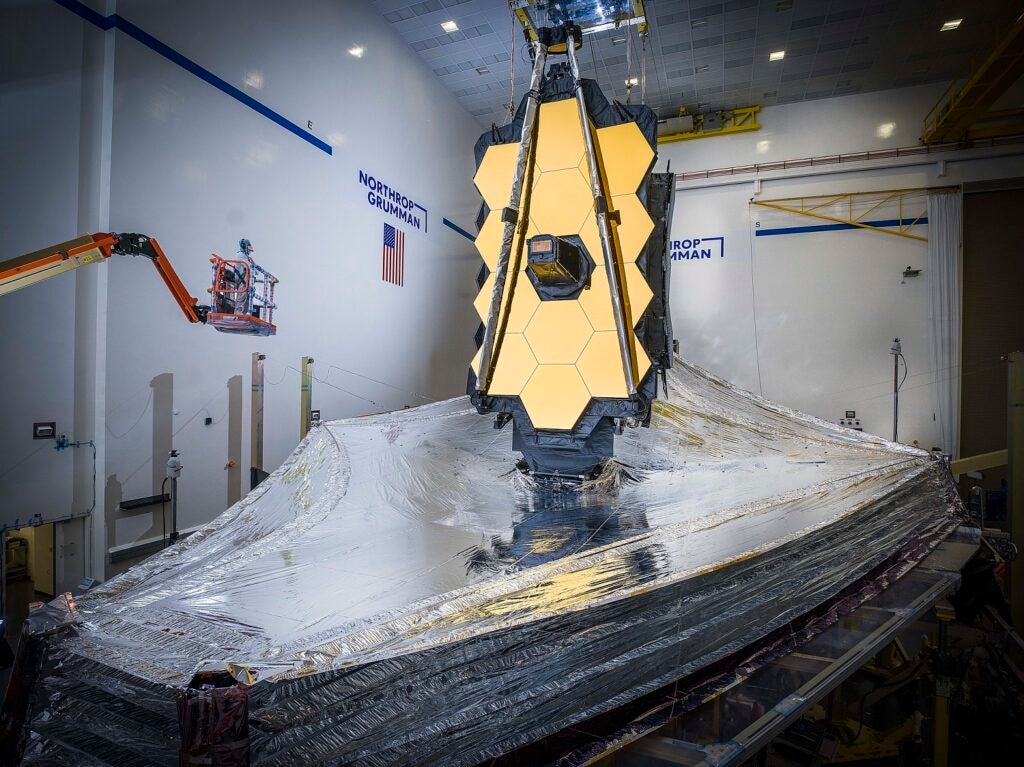
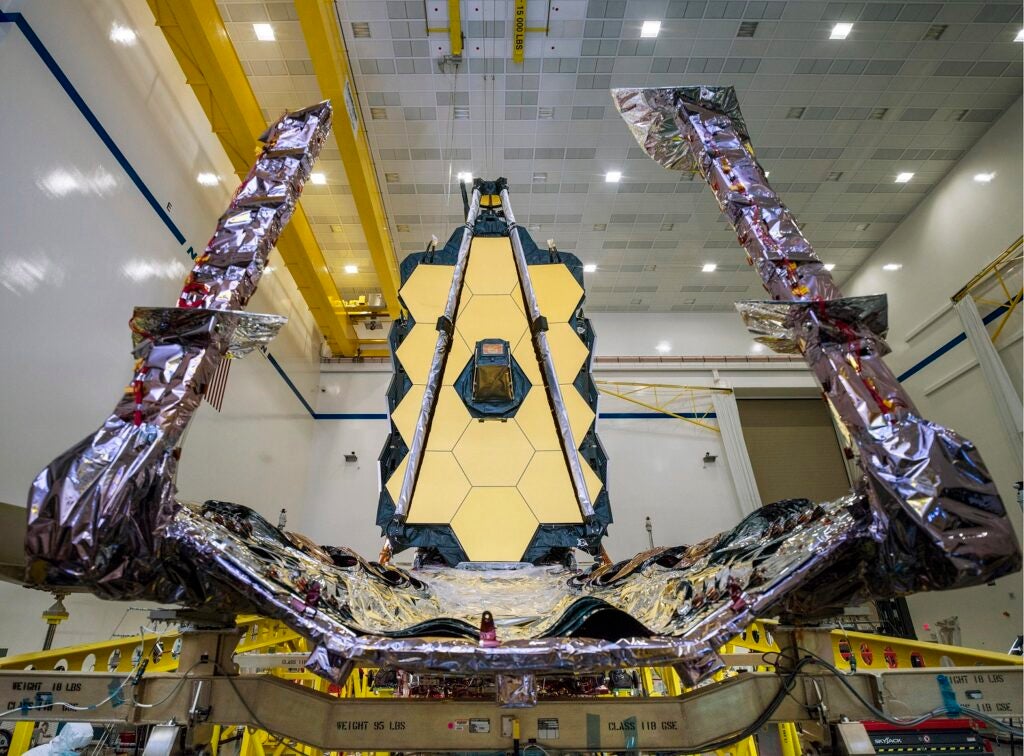
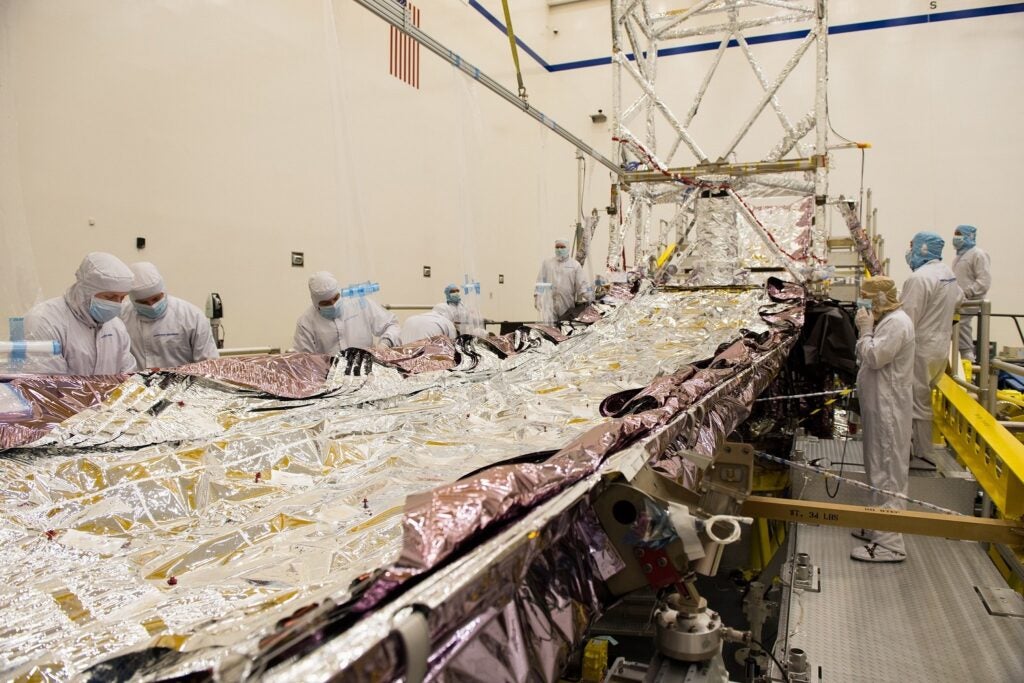
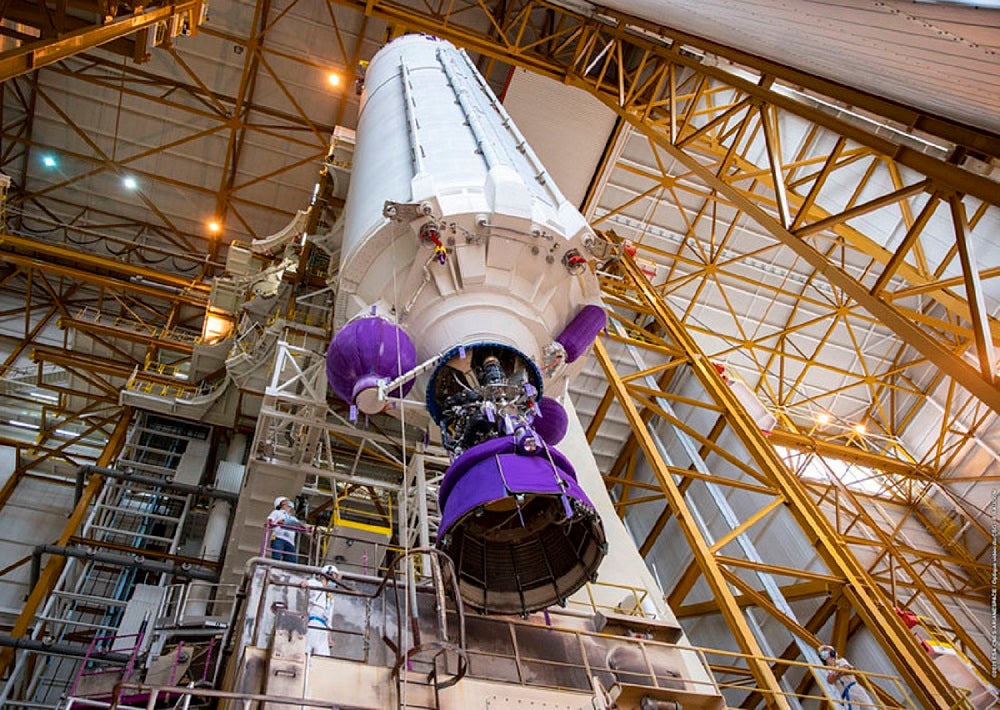
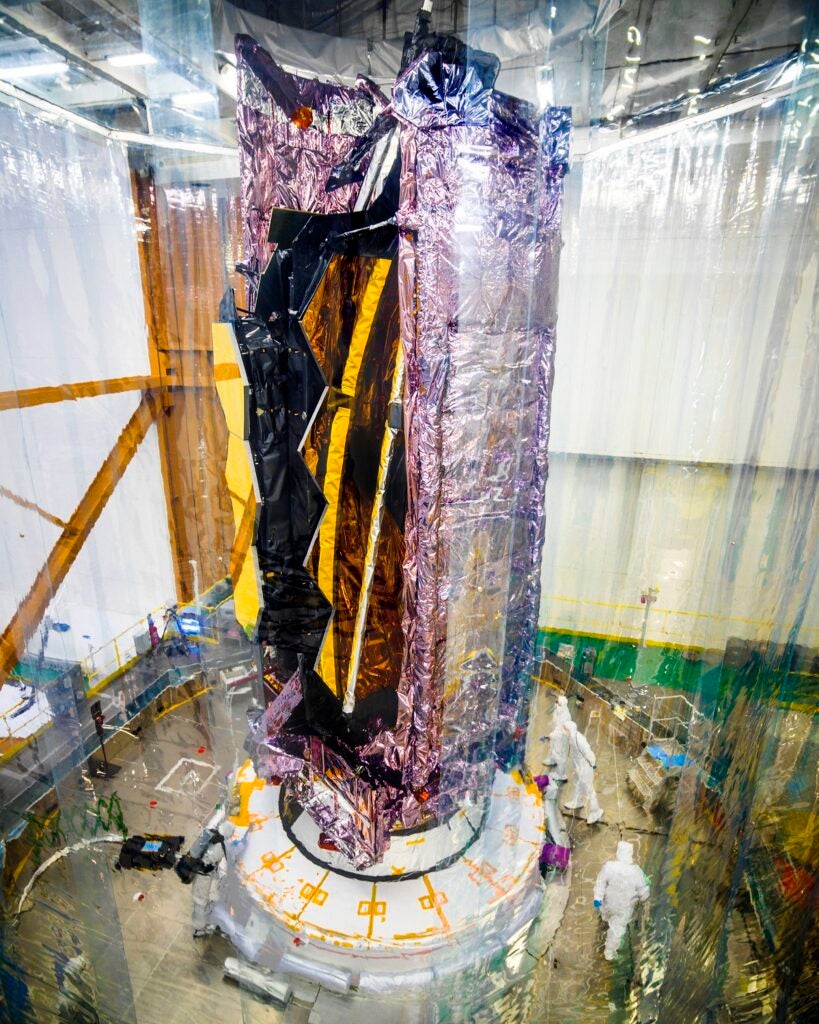
When the US, Europe, and Canada first unveiled the plans for the James Webb Space Telescope in 1997, it sounded like a pitch from an overambitious science student. The contraption would have to schlep a 26-foot-wide mirror across the solar system, while keeping its cool around the radioactive sun. But to build the Next Generation Space Telescope (as it was called at the time), astronomers had to think big. Hubble, the preeminent space telescope, needed a successor—and there were too many open questions about the Big Bang and the expanding universe.
So it’s fair to say, the stakes are higher than imagined. As the world cautiously waits for the telescope to kick off its decade-long mission (the launch date is currently set for Christmas morning), here’s a look back on what it took to prepare it for this moment.
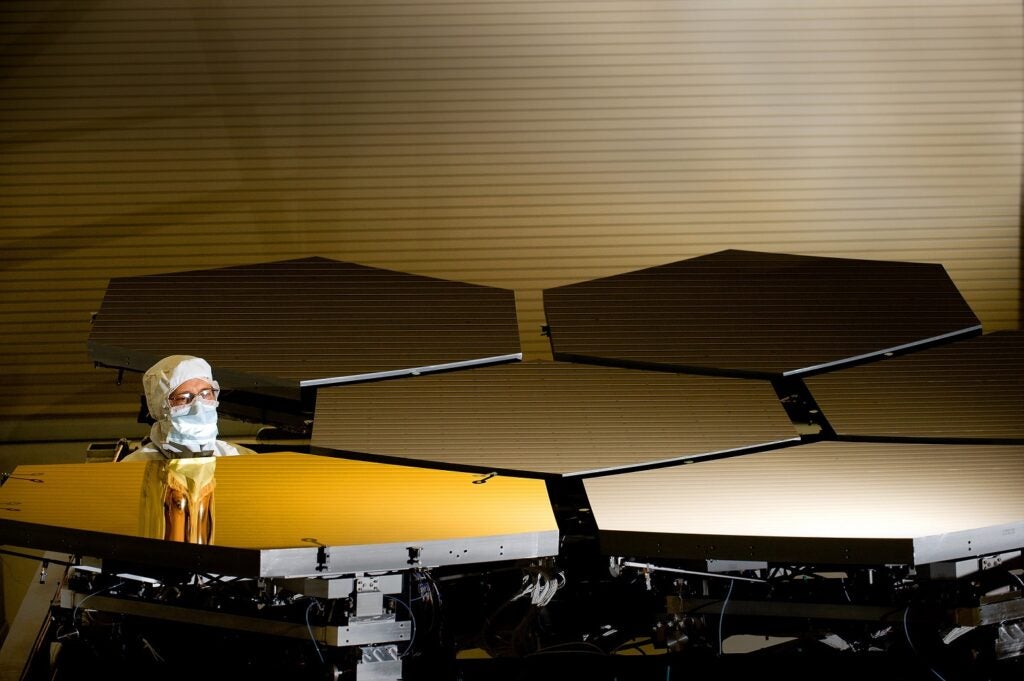
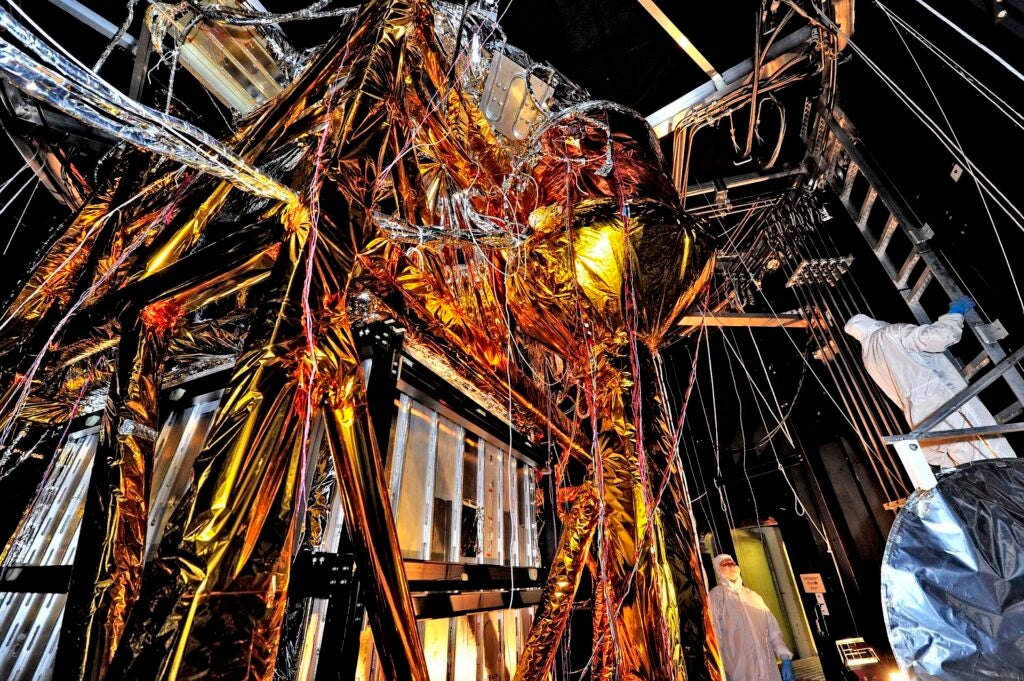
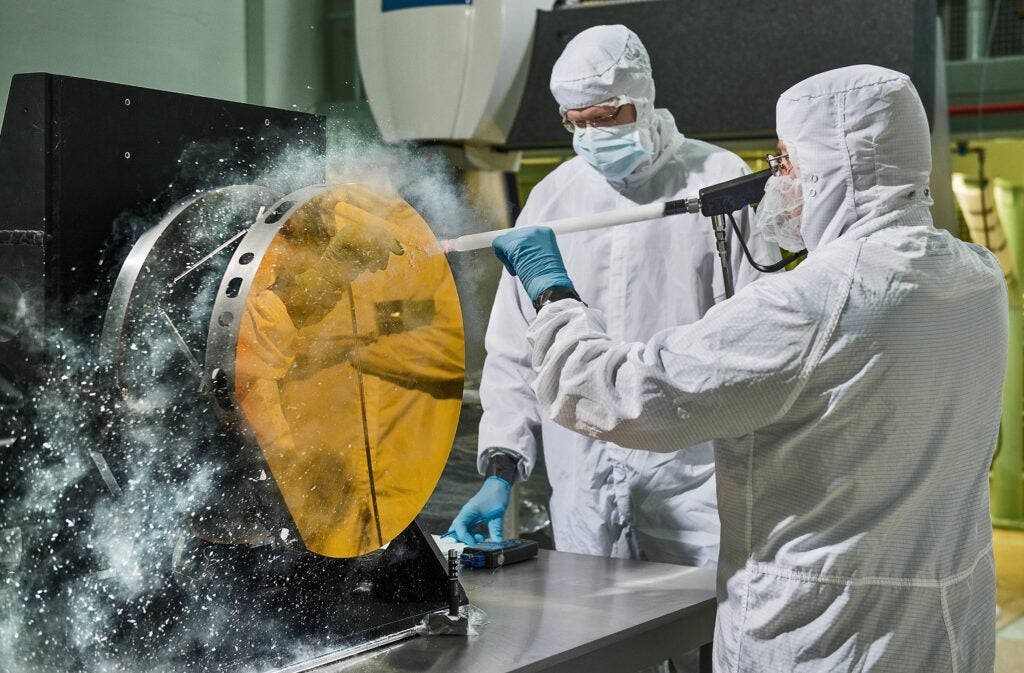
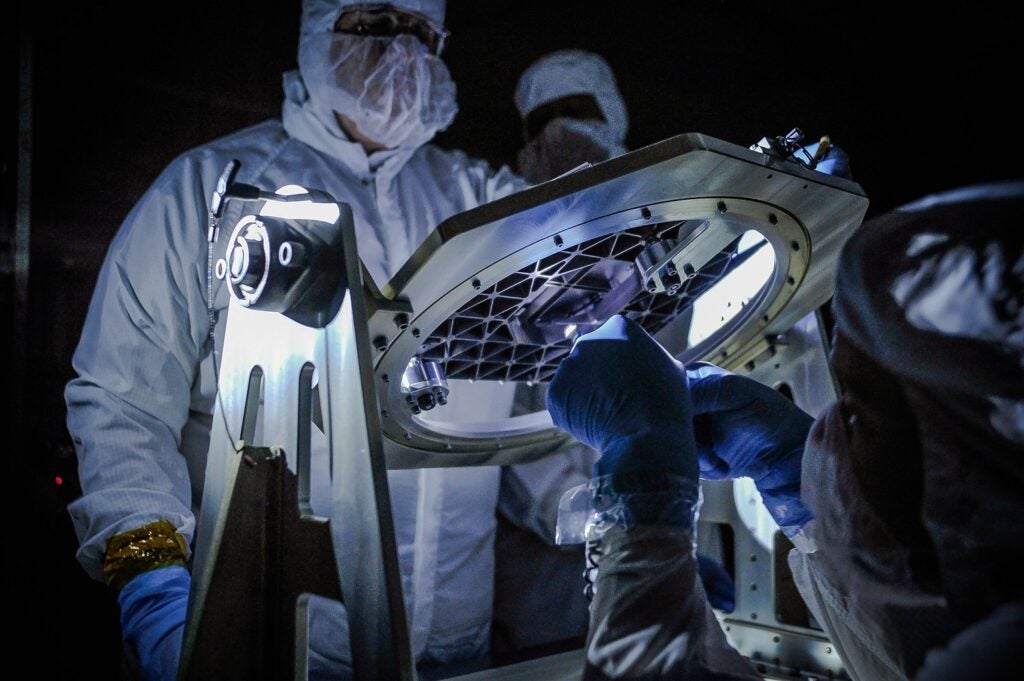
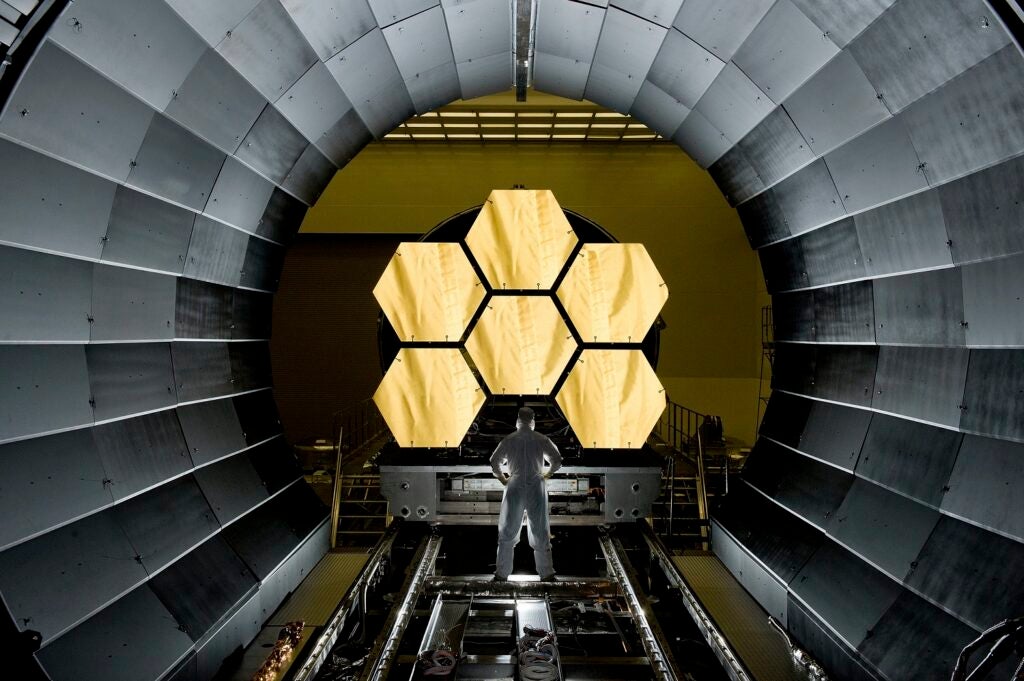
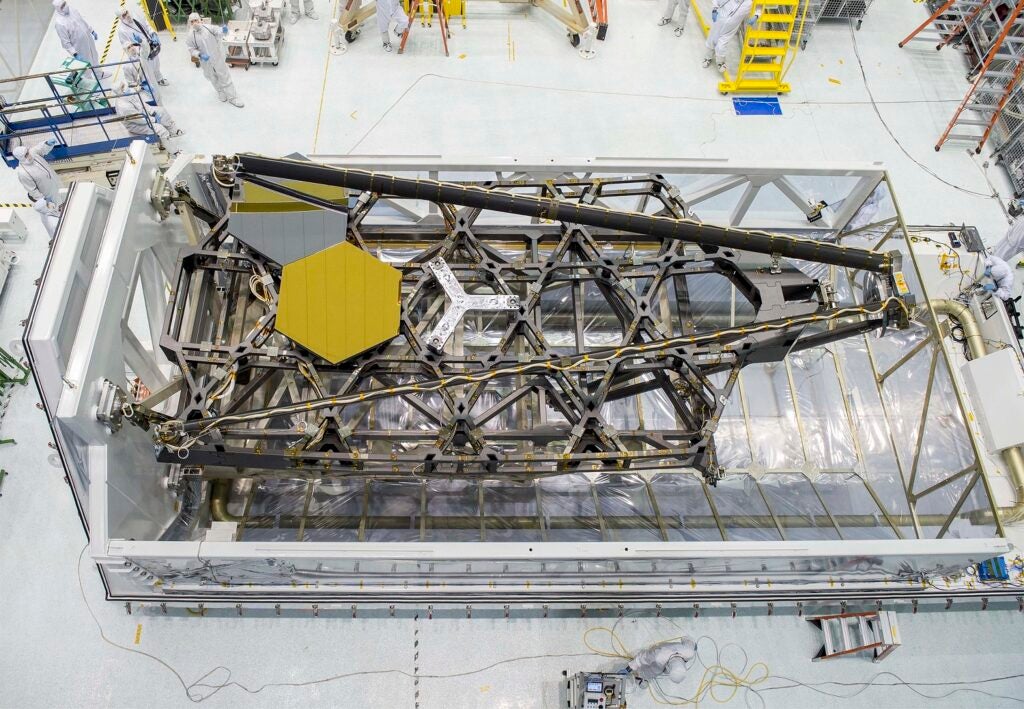
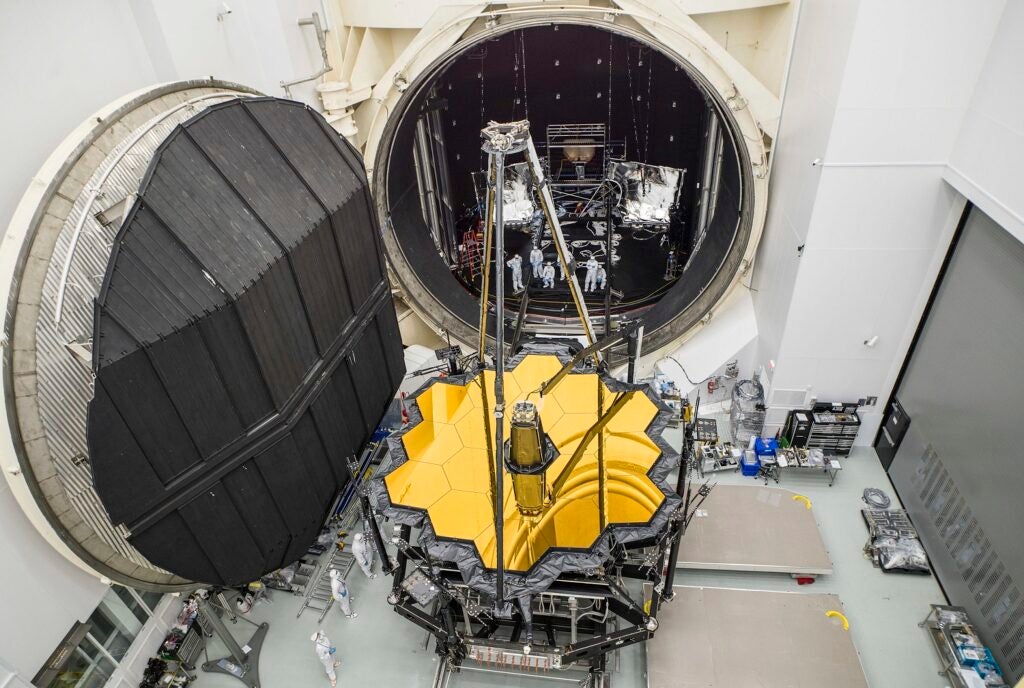
An early concept for the James Webb Space Telescope—known at the time as the Next Generation Space Telescope—was designed by a Goddard Space Flight Center-led team. It already incorporated a segmented mirror, an “open” design, and a large deployable sunshield. In 1996, an 18-member committee led by astronomer Alan Dressler formally recommended that NASA develop a space telescope that would view the heavens in infrared light—the wavelength band that enables astronomers to see through dust and gas clouds and extends humanity’s vision farther out into space and back in time. NASAA full-scale model of the James Webb Space Telescope debuted for the first time in 2013 at the South by Southwest festival in Austin, Texas. Chris Gunn/NASABall Aerospace optical technician Scott Murray inspects the first gold primary mirror segment, a critical element of NASA’s James Webb Space Telescope, prior to cryogenic testing at the Marshall Space Flight Center in Huntsville, Alabama. David Higginbotham/NASA/MFSCWhat looks like a giant golden spider weaving a web of cables and cords, is actually ground support equipment, including the Optical Telescope Simulator (OSIM), for the James Webb Space Telescope. OSIM’s job is to generate a beam of light just like the one that the real telescope optics will feed into the actual flight instruments. This photo was taken from inside a large thermal-vacuum chamber called the Space Environment Simulator (SES), at the Goddard Space Flight Center in Greenbelt, Maryland. The golden-colored thermal blankets are made of aluminized Kapton, a polymer film that remains stable over a wide range of temperatures. The structure that looks like a silver and black cube underneath the “spider” is a set of cold panels that surround OSIM’s optics. Chris Gunn/NASAJust like drivers sometimes use snow to clean their car mirrors in winter, two Exelis Inc. engineers are practicing “snow cleaning’” on a test telescope mirror for the James Webb Space Telescope at NASA’s Goddard Space Flight Center. By shooting carbon dioxide snow at the surface, engineers are able to clean large telescope mirrors without scratching them. This technique was only used if the James Webb Space Telescope’s mirror was contaminated during integration and testing. Chris Gunn/NASANASA engineers inspect a new piece of technology developed for the James Webb Space Telescope, the micro shutter array, with a low light test at NASA’s Goddard Space Flight Center. Developed at Goddard to allow Webb’s Near Infrared Spectrograph to obtain spectra of more than 100 objects in the universe simultaneously, the micro shutter array uses thousands of tiny shutters to capture spectra from selected objects of interest in space and block out light from all other sources. Laura Baetz/NASA’s Goddard Space Flight CenterNASA engineer Ernie Wright looks on as the first six flight-ready James Webb Space Telescope’s primary mirror segments are prepped to begin final cryogenic testing at the Marshall Space Flight Center. This represents the first six of 18 segments that will form NASA’s James Webb Space Telescope’s primary mirror for space observations. David Higginbotham/NASA/MFSCContamination from organic molecules can harm delicate instruments and engineers are taking special care at NASA to prevent that from affecting the James Webb Space Telescope (and all satellites and instruments). Nithin Abraham, a thermal coatings engineer, places Molecular Adsorber Coating or “MAC” panels in the giant chamber where the Webb telescope was tested. This contamination can occur through a process when a vapor or odor is emitted by a substance. This is called “outgassing.” The “new car smell” is an example of that, and is unhealthy for people and sensitive satellite instruments. Christ Gunn/NASAA bird’s-eye view of NASA Goddard’s cleanroom and the James Webb Space Telescope’s test backplane and mirrors sitting in their packing case. Chris Gunn/NASAThe James Webb Space Telescope emerges from Chamber A at the Johnson Space Center in Houston on December 1, 2017. The telescope’s combined science instruments and optical element exited the massive thermal vacuum testing chamber after about 100 days of cryogenic testing inside it. Scientists and engineers at Johnson put Webb through a series of tests designed to ensure the telescope functioned as expected in an extremely cold, airless environment akin to that of space. Chris Gunn/NASAThe Kapton® polymer-coated membranes of Webb’s sunshield were fully deployed and tensioned in December at Northrop Grumman in Redondo Beach, California. Northrop Grumman designed the observatory’s sunshield for NASA. During testing, engineers sent a series of commands to spacecraft hardware that activated 139 actuators, eight motors, and thousands of other components to unfold and stretch the five membranes of the sunshield into its final taut shape. A challenging part of the test is to unfold the sunshield in Earth’s gravity environment, which causes friction, unlike unfolding material in space without the effects of gravity.For launch the sunshield will be folded up around two sides of the observatory and placed in an Ariane 5 launch vehicle, which is provided by the European Space Agency. Chris Gunn/NASAReaching a major milestone, technicians and engineers successfully connected the two halves of the James Webb Space Telescope for the first time at Northrop Grumman’s facilities in Redondo Beach, California. To combine both halves of Webb, engineers carefully lifted the telescope (which includes the mirrors and science instruments) above the already-combined sunshield and spacecraft using a crane. Team members slowly guided the telescope into place, ensuring that all primary points of contact were perfectly aligned and seated properly. Next the team would have to electrically connect the halves, and then test the electrical connections. Chris Gunn/NASATechnicians and engineers working to ensure the soundness of the James Webb Space Telescope by manually lower its folded sunshield layers for easier access and inspection. After being lowered, engineers thoroughly inspect all five layers of the reflective silver-colored sunshield for any issues that may have occurred as a result of acoustic testing. Acoustic testing exposes the spacecraft to similar forces and stress experienced during liftoff, allowing engineers to better prepare it for the rigors of spaceflight. Chris Gunn/NASAThe arrival of the James Webb Space Telescope to Port de Pariacabo in French Guiana on October 12, 2021. It traveled from California, through the Panama Canal, aboard the MN Colibri. 2021 ESA-CNES-Arianespace/Optique vidéo du CSG – JM GuillonThe Ariane 5 core stage is 5.4 meters in diameter and 30.5 meters high. At launch it will contain 175 tons of liquid oxygen and liquid hydrogen propellants. With its Vulcain 2 engine it provides 140 tons of thrust. It also provides roll control during the main propulsion phase. This rolling maneuver will ensure that all parts of the payload are equally exposed to the sun which will avoid overheating of any elements of the James Webb Space Telescope. Chris Gunn/NASAThe James Webb Space Telescope atop its launch vehicle, before it was encapsulated in the rocket fairing. A protective clean tent was placed around the telescope until launch time. Chris Gunn/NASA
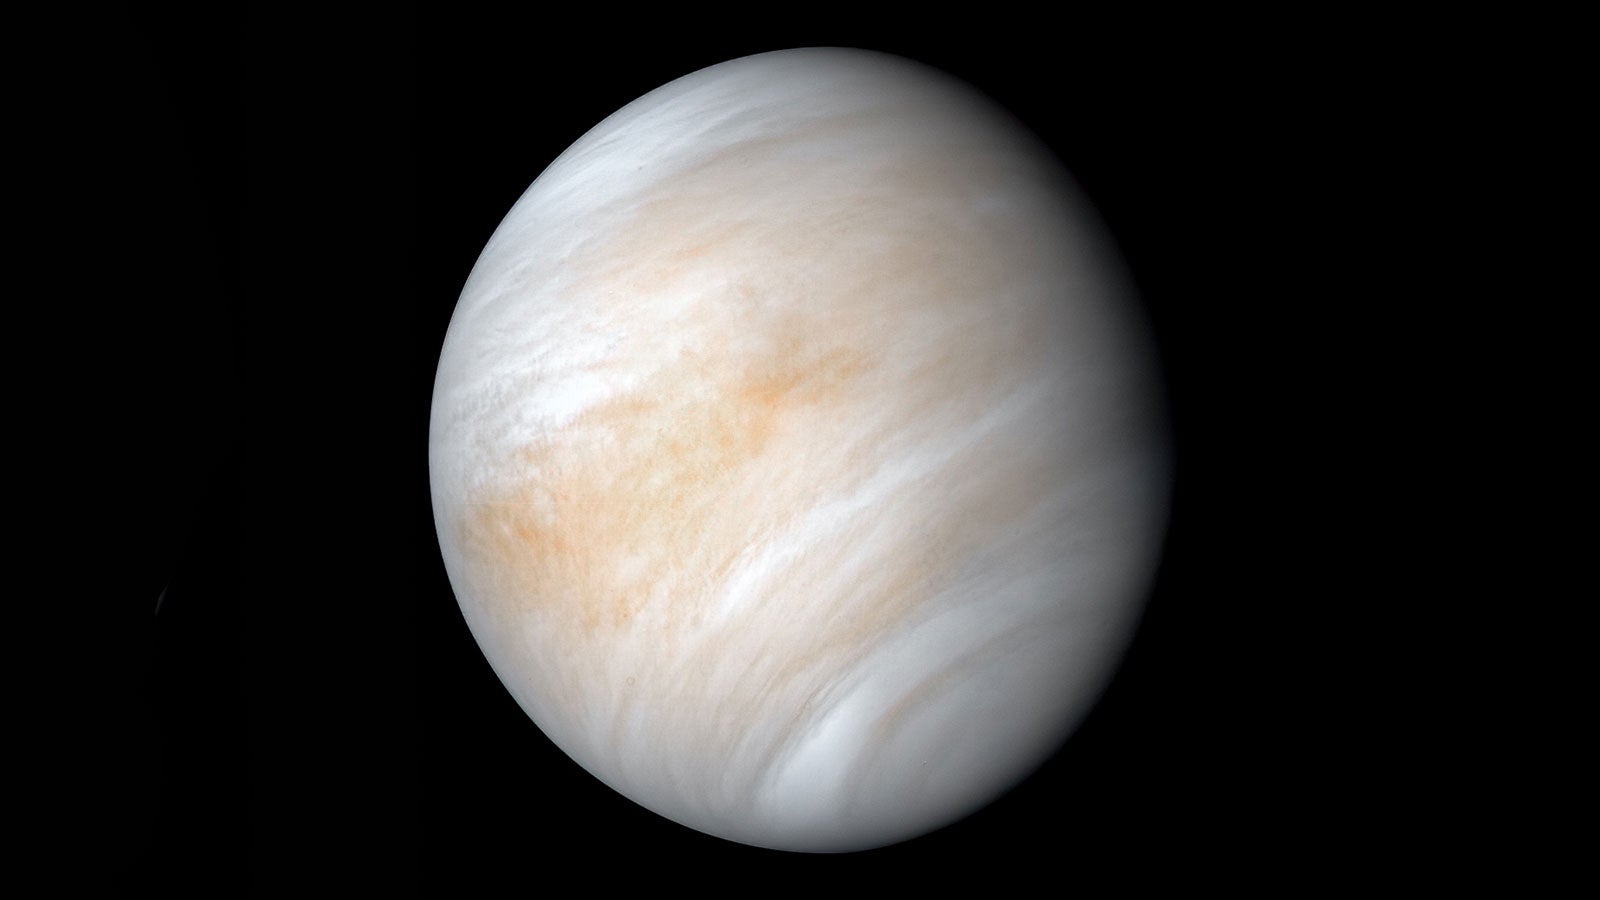
Life as we know it shouldn’t be able to survive in Venus’s swirling atmosphere of carbon dioxide and sulfuric acid. Its clouds are so acidic, in fact, that they don’t even register on the regular pH scale. But a new study published in the Proceedings of the National Academy of Sciences suggests that under the right circumstances, certain lifeforms could make a home for themselves by producing ammonia in the planet’s toxic clouds.
The clouds of Venus contain a few tantalizing anomalies—and the unanswered questions for why these anomalies exist leave open the possibility for life on the planet. Researchers have found, for instance, that the concentration of sulfur dioxide dramatically drops higher up in the atmosphere without a known explanation.
To understand why this depletion occurs, Paul Rimmer, a postdoctoral researcher in astrochemistry at the University of Cambridge and co-author of the new study, examined the chemical makeup of the sulfuric acid droplets in the high clouds. There, “instead of being like pure battery acid, it’s a bit more like stomach acid,” Rimmer says. “Still very acidic, but not as acidic.”
Researchers had theorized that acid-neutralizing salts could be swept up into the clouds from the planet’s surface–but the amount of mineral salt needed is too extreme, according to Rimmer’s previous calculations. Now, the research team has proposed a new hypothesis to explain the acidity anomaly: What if the cause wasn’t a mineral from the surface, but a substance produced in the clouds?
The researchers created a model using ammonia, NH3, as the neutralizing agent. Ammonia had been unexpectedly detected in the cloud layers in the 1970s by the Venera 8 and Pioneer Venus probes. This ammonia could be a sign of metabolic activity naturally occurring on Venus—meaning that the atmosphere is home to some form of life, according to Janusz Petkowski, an astrobiology research scientist at MIT and co-author of the paper.
When Rimmer and his colleagues added ammonia into their model of chemical reactions in Venus’s clouds, the ammonia explained the known abundance of water vapor and oxygen in its atmosphere. Chemical pathways involving this compound can also explain previously detected sulfite salts in the cloud droplets.
The harsh conditions in this atmosphere are not unlike extreme environments on Earth, such as the Dallol sulfur pools of Ethiopia, where luminescent yellow pools harbor a few hardy species of bacteria. What’s more, microorganisms on Venus might be shaping their own habitat to be less harsh by producing the ammonia that neutralizes acid. “If life on Venus exists, and if it indeed is responsible for making ammonia, then it makes its own environment in which it lives. It adapted,” says Petkowski.
While ammonia provides a neat solution in this model, this doesn’t necessarily mean that the ammonia is a result of biological processes.
“The responsible thing to do as scientists and astrobiologists interested in this is that we have to cultivate the habit of mind where we assume it’s everything but life first,” says David Grinspoon, a senior scientist at the Planetary Science Institute who was not involved with this research. “There are other things that can happen” in an atmosphere to produce these gases, he says, calling for experts to “rule out everything else” before making claims about life on Venus.
The study authors acknowledge that, while ammonia is a byproduct of life on Earth, the ammonia found on Venus may not be created in the same way. There might be non-biological ways of producing ammonia on other planets that we’re not currently aware of, Rimmer explains.
And even if life on Venus isn’t responsible for ammonia, Grinspoon says, there is still some exotic chemistry at play that is worth trying to discover.
For Rimmer, the key to making further assessments is to have new atmospheric probe data with more advanced technology to make sure that existing data from the 1970s and 1980s did not include anomalous results or false positives.
Interpreting data from the old instruments on the probes is actually quite tricky, Grinspoon adds, posing another problem for making inferences from those initial measurements.
In about a decade, scientists may receive a bounty of data on this cloud chemistry. NASA has scheduled the DAVINCI+ atmospheric probe, planned to launch in 2029, to carry out the first complete compositional study of the entire cross-section of Venus’ atmosphere. Another initiative by private spaceflight company Rocket Lab aims to send a probe to look for biosignatures in Venus’ clouds by 2023.
Meanwhile, Petkowski and the other authors are pushing their colleagues to rethink what it means for a planet to be habitable.
“We should not overextend our understanding of life’s adaptations to absolutely every planetary body everywhere, because our life has never had an environment like the clouds of Venus to even consider adapting to,” says Petkowski. “And so life on Venus, if it exists, is not like life on Earth. It’s life as we don’t know it. The only question is, to what degree it is different?”
This story originally featured on Nexus Media News, a nonprofit climate change news service.
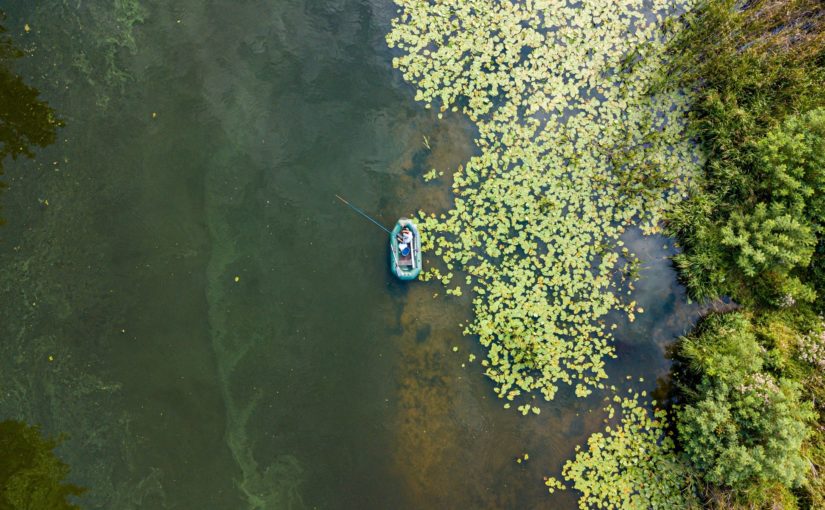
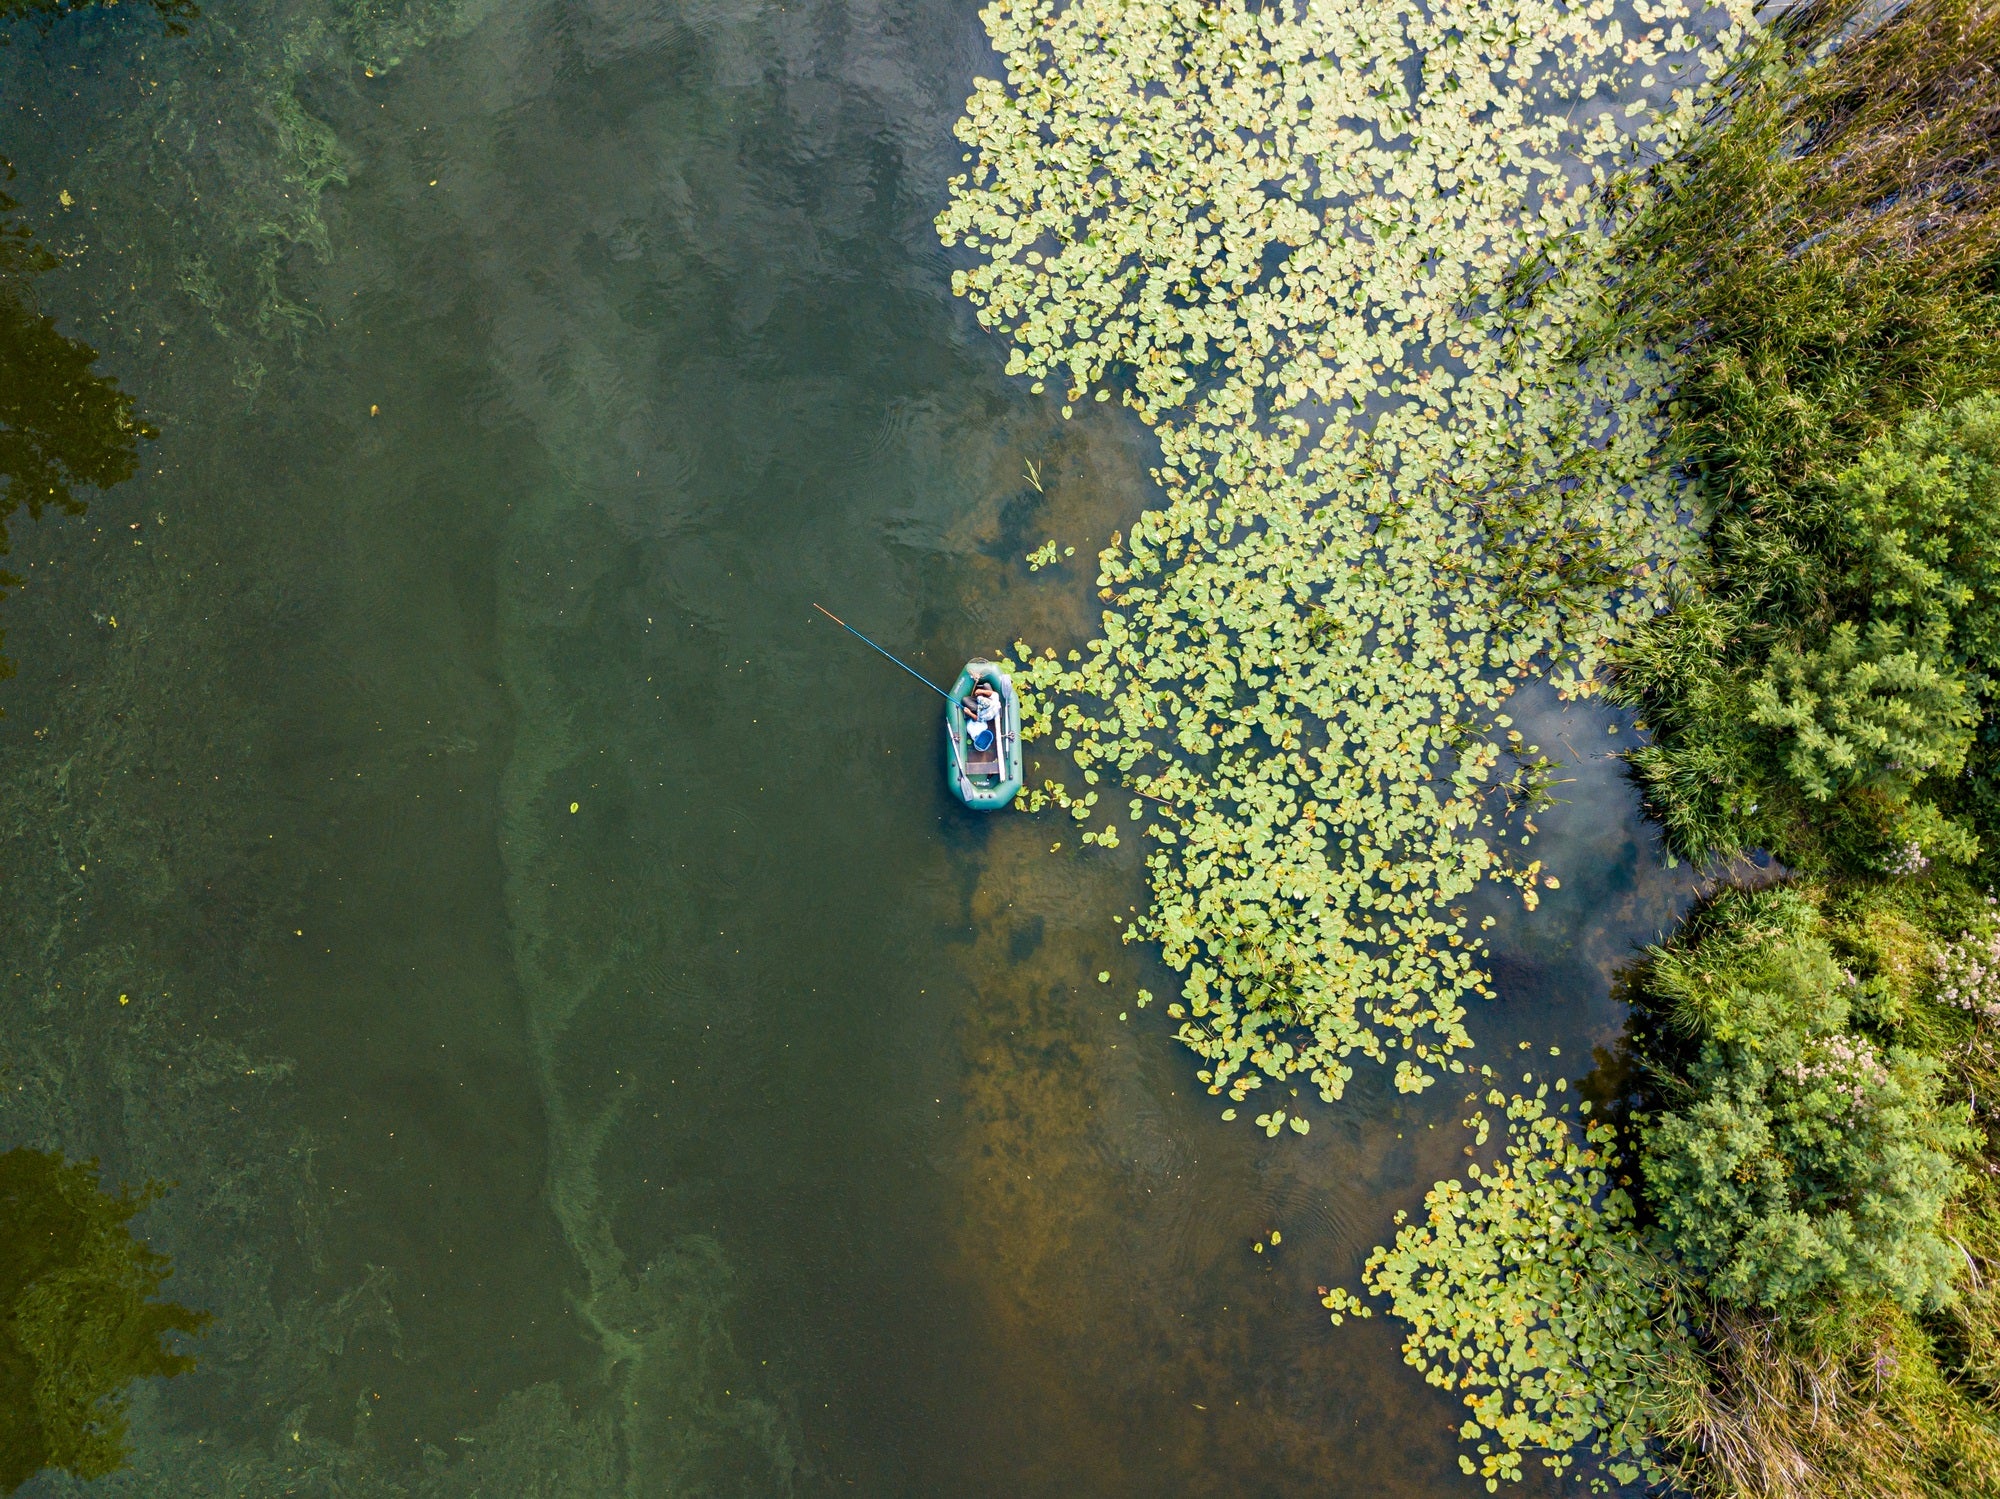
On a sweltering morning in July of 2021, thousands of dead fish washed onto the northeastern shores of Pokegama Lake, 140 miles north of Minneapolis.
Deb Vermeersch, an official with the Minnesota Department of Natural Resources, was called in to investigate.
When she arrived, she saw a quarter-mile stretch of sand covered with the rotting carcass of walleye and Northern pike, which thrive in deep, cool waters, as well as crappies, sunfish and suckers—all warm water dwellers. “They were already pretty decomposed because of the warm water,” Vermeersch recalls.
Because so many different types of fish had died, Vermeersch and her colleagues knew it wasn’t a species-specific parasite, a common cause of fish kills. They zeroed in on the culprit: dangerously low oxygen levels.
Oxygen is disappearing in freshwater lakes at a rate nine times that of oceans due to a combination of pollution and warming waters, according to a study published in Natureearlier this year. Lakes like Pokegama are warming earlier in the spring and staying warm into autumn, fueling algae blooms, which thrive in warm waters, and threaten native fish.
Minnesota, with its 14,380 lakes and temperatures that have risen faster than the national average, is a unique laboratory for studying how climate change is affecting temperate-zone lakes around the world. The state sits at the intersection of four biomes––two distinct prairie ecosystems and two ecologically different forest systems. This means scientists here are able to study how lakes in different ecosystems fare on a warming planet, and look for ways to stave off the worst effects of climate change.
“If you start losing oxygen, you start losing species.“
“What’s going on at the surface is that warmer water holds less oxygen than cool water,” says Lesley Knoll, a University of Minnesota limnologist and one of the authors of the Nature report. She says that longer, hotter summers are interfering with two key processes that have historically kept lakes’ oxygen levels in check: mixing and stratification. In temperate climates, water at the surface of lakes mixes with deep waters in the spring and the fall, when both layers are similar in temperature. As the surface water warms during the summer, the water forms distinct layers based on temperature––cool water at the bottom, warm at the top. This is known as stratification. In the fall, when the surface waters cool again, the water mixes for a second time, replenishing oxygen in deeper waters. But as climate change makes surface water warmer, and keeps it warmer for longer, that mixing doesn’t happen when it should.
“As you have that stronger stratification, the water in the deep part of the lake is cut off from the oxygen at the top part of the lake. If you start losing oxygen, you start losing species,” says Kevin Rose, a biologist at Rensselaer Polytechnic Institute in New York and a coauthor of the Nature study.
Knoll, Rose and a team of 43 other researchers studied 400 temperate lakes from around the world. They found that, on average, surface waters warmed by 7 degrees Fahrenheit and have lost roughly 5 percent of oxygen since 1980; deep waters, which haven’t warmed much, have still lost an average of almost 20 percent of their oxygen. (Thanks to the state’s long-held lake monitoring programs, almost a quarter the lakes in the study were in Minnesota.)
Warming lakes emit methane
Fish kills aren’t the only reason scientists are concerned about lakes losing oxygen. In extreme cases, when deep waters go completely void of oxygen, something else happens: Methane-emitting bacteria begin to thrive.
“As lakes warm, they will produce more methane and most of that has to do with stratification,” says James Cotner, a limnologist at the University of Minnesota.
Lakes normally emit carbon dioxide as a natural part of breaking down the trees, plants and animals that decay in them, but plants in and around fresh water also absorb it, making healthy lakes carbon sinks.
Lakes have historically emitted methane, too––about 10 to 20 percent of the world’s emissions––but the prospect of them releasing more of the greenhouse gas has Cotner and his colleagues alarmed. Methane is about 25 times more potent than CO2 when it comes to trapping heat in Earth’s atmosphere.
Cotner is leading a team of researchers who are studying what conditions allow methane-emitting bacteria to prosper in lakes and how conservationists can respond.
“The key questions are understanding how much and when carbon dioxide and methane are emitted from lakes, and what are the key variables that can tell how much will be emitted. Certainly, oxygen is a big part of that, but stratification and warming also plays a role,” says Cotner.
[embedded content]
Pollution plays a big role
It’s not just longer, hotter summers that are causing lakes to lose their oxygen. Polluted agricultural runoff (pesticides and fertilizers) and logging have long plagued Minnesota’s lakes. It’s a problem that’s getting worse worldwide as climate change pushes agriculture further away from the equator and into new territory, says Heather Baird, an official with Minnesota’s Department of Natural Resources.
In northern Minnesota, potatoes now grow where pine forests have thrived for years. Phosphorus, a common fertilizer, now runs off from the soil into the region’s lakes, Baird says. Though small amounts of phosphorus occur naturally in lake ecosystems, too much of it feeds harmful algae blooms.
Those blooms, which thrive in warm, nutrient-rich water, set off a chain of events that remove oxygen from deep lake waters.
“When phosphorus builds in lakes and creates algae blooms, those blooms eventually die. As they do, they sink. Deeper down, bacteria break down the algae, using up the remaining oxygen at those lower depths,” said Baird.
A quarter of Minnesota lakes now have phosphorus levels that are so high that the state advises against swimming, fishing or boating in them. Fueled by these nutrients, algae blooms take over, covering the lake in sometimes toxic residue that thrives in warm, nutrient-rich water, as was the case in Pokegama Lake earlier this year. The protists choke out aquatic life, especially fish that thrive in cold, deep waters. This is all exacerbated by warming air temperatures.
The 75 percent rule
Researchers and conservationists in Minnesota are now studying the best ways to protect temperate-climate lakes from the worst effects of climate change. They have found that preserving 75 percent of deep-water lakes’ watersheds appear to keep fish stocks healthy.
“Having a forested watershed helps keep better water quality by filtering out nutrients, which in turn can buffer against the impacts of climate change, to a point,” Knoll said. However, she added, as temperatures continue to rise, “that 75 percent may not be high enough anymore.”
Knoll and state conservationists are focusing their research and efforts on deep, cool lakes that have a better chance of staying oxygenated than warmer, shallower lakes, like Pokegama.
Vermeersch, the Minnesota fisheries supervisor, said it’s unclear what this will mean for the future of lakes like Pokegama. “Hopefully it’s not going to be a linear thing,” she said, adding that fish kills are “probably going to happen more often,” depending on a combination of factors. “When you get lakes like Pokegama that are shallow and already impaired, I think we are going to see more and more conditions like this
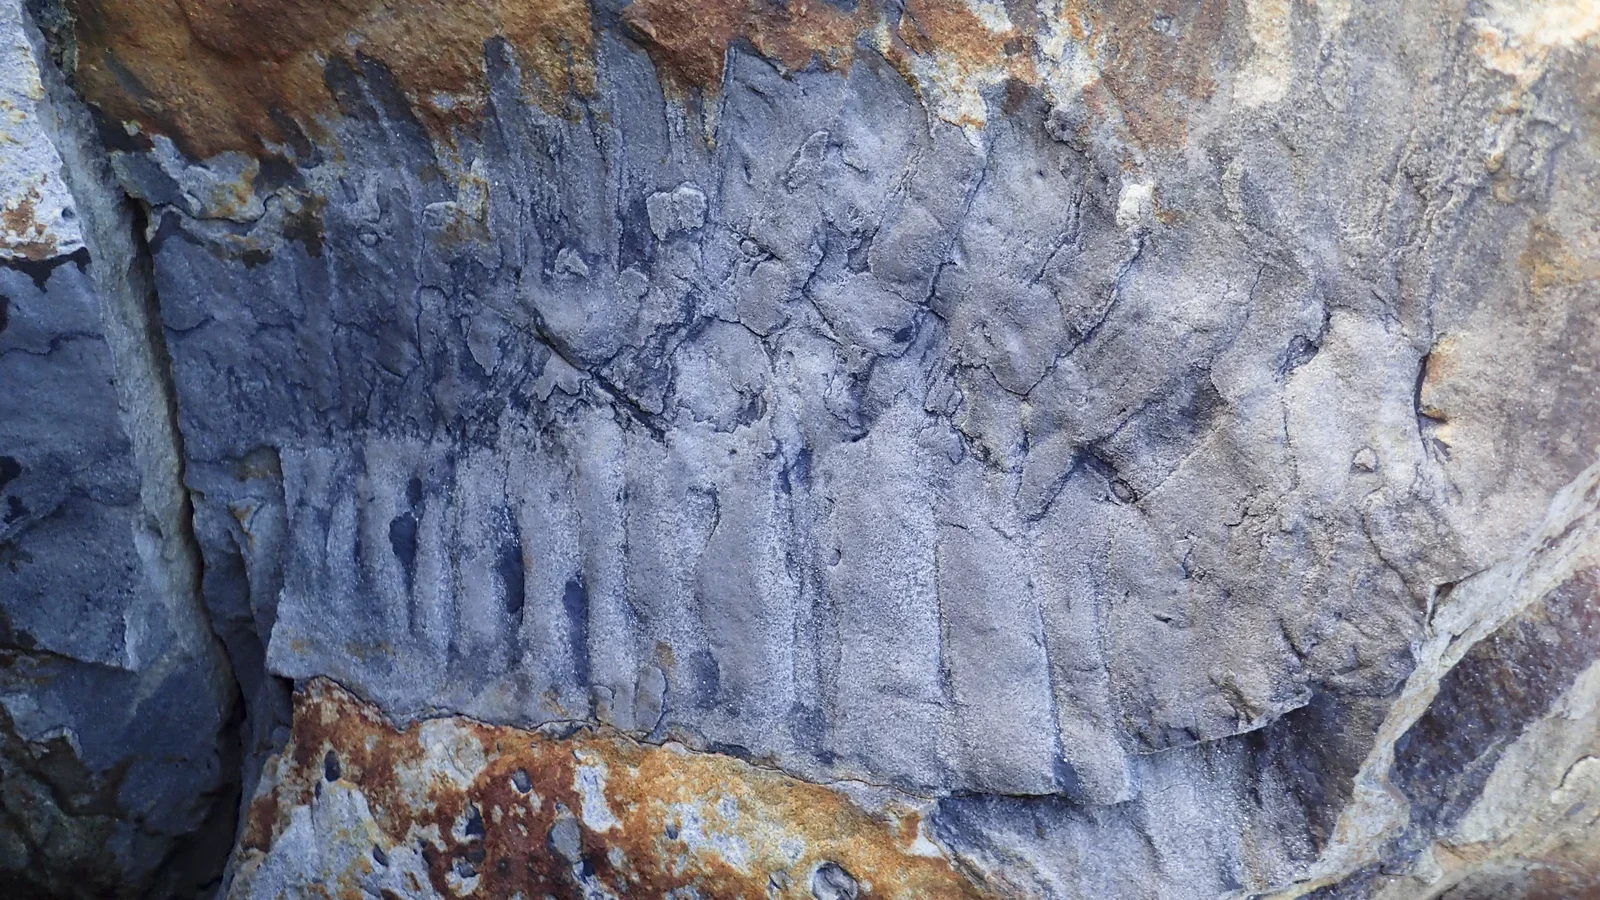
A fossil found in sandstone near the England-Scotland border contains the largest millipede ever found—and the discovery was completely by accident.
In January 2018, Neil Davies, an Earth scientist at the University of Cambridge, had taken a group of PhD students on a “social trip” to Northumberland, England, where he had previously gone on holiday. The group noticed some rocks had crashed onto the beach where they were walking. One of those chunks happened to contain a paleontological surprise.
“The way the boulder had fallen, it had cracked open and perfectly exposed the fossil, which one of our former PhD students happened to spot when walking by,” Davies said in a statement. “It was a complete fluke of a discovery.”
Davies and his colleagues were at first unsure about what they had found. In May 2018, they extracted the fossil and brought it back to Cambridge for analysis. The specimen is just the third known example of an Arthropleura, a genus of giant millipede that roamed the Earth during the Carboniferous Period, between 359 million and 299 million years ago. But that’s not all: This Arthropleura fossil is also the oldest ever found, dating back to 326 million years ago, as well as the largest. It measures a whopping 30 inches by 14 inches.
That suggests a pretty impressive beast. The millipede itself was likely around 8.5 feet long and nearly two feet wide, and probably weighed about 110 pounds. The team’s results were published in the Journal of the Geological Society.
“Finding these giant millipede fossils is rare, because once they died, their bodies tend to disarticulate,” Davies told BBC. This particular specimen is likely just part of a molted exoskeleton, rather than a piece of a millipede’s corpse. Such a sparse fossil record means that these bugs largely remain a mystery. To this day, “we have not yet found a fossilised [millipede] head,” Davies added, “so it’s difficult to know everything about them.”
For example, researchers are unsure how many legs these millipedes had. Current best guesses are either 32 or 64—a paltry set compared to the maximum 1,300 legs recently found on some living millipedes. Scientists also don’t know what these giant bugs ate to sustain their lumbering bodies, though they seem to have thrived due to an abundance of resources and little competition. But later, in the Permian Period, they went extinct—either because of a changing climate or due to new reptile species outcompeting them for food. To uncover the mysteries still lurking in giant millipedes’ history, researchers will need more examples of them to fill out the fossil record.
The area of Northumberland where the fossil was found is mostly sandstone, which “is normally not brilliant for preserving fossils,” Davies told NPR. So “the fact that this has been preserved is, on the one hand, surprising. But it just suggests that actually there might be a lot more and similar things in places where people haven’t really looked for fossils before.”
The fossil will go on public display at Cambridge’s Sedgwick Museum in the New Year.
Over the last week, headlines across the internet suggested that Omicron might cause a milder form of illness compared to previous COVID variants. Many of the stories stemmed from a recent report from Discovery Health, a large healthcare and insurance system in South Africa. The report found that based on a 200,000-person study, adults were 29 percent less likely to be hospitalized now than they were during the first wave of the pandemic.
But COVID researchers continue to say that findings like these don’t necessarily mean that Omicron is intrinsically milder. In fact, they might suggest that vaccines combined with prior infection might simply be preventing deadly outcomes, as they were intended to do. The Discovery researchers themselves note that, given a 35 percent adult vaccination rate and a population that has already recovered from other COVID variants, it’s hard to estimate Omicron’s “true severity.”
In South Africa, cases in the Omicron wave have already begun peaking after three weeks, but deaths haven’t climbed as quickly as in previous waves. “We believe it might not necessarily just be that Omicron is less virulent, but coverage of vaccination [and] natural immunity … also adding to the protection,” Joe Phaahla, the country’s health minister, told Britain’s the Times.
South Africa recently recovered from a national Delta surge, epidemiologists at Massachusetts General Hospital and Harvard’s School of Public Health noted in a working paper this week. “Thus, Omicron enters a South African population with considerably more immunity than any prior SARS-CoV-2 variant has encountered,” the researchers wrote, “enriched among those who would have been at greatest risk for severe outcomes.”
The result, they wrote, suggest “the true risk of severe infection will be systematically underestimated.”
Darryl Falzarano, a vaccine researcher at the University of Saskatchewan, says that estimating severity becomes harder as time goes on. “How many infections did we miss that are asymptomatic, or never ended up getting diagnosed?” he says. “If those people now get infected with Omicron, you would expect severity to be lower… Pulling that apart and knowing if it’s truly a naive Omicron infection”—in someone who’s never been infected or vaccinated—makes assessing severity difficult.”
The recent report in Discovery Health is complicated by the fact that children under 18 were 20 percent more likely to be admitted to the hospital with Omicron than in the first wave, though much less likely than adults. “In the fourth wave, [South African hospitals] are seeing a similar increase in admissions [to Delta] for children under five years of age,” wrote Shirley Collie, Discovery’s top health actuary, in the report. The highest rates of admission were among children under 5.
That could be because children are more representative of a naive population. South Africa approved vaccines for 12 to 17 year olds in October, and children have been less likely to catch and spread the coronavirus. That would suggest that Omicron is more severe, at least in children. But that’s not necessarily what’s happening. “It’s children who have become the most unvaccinated of our population, and as expected, cases are going to concentrate in those age groups,” says Sallie Permar, pediatrics chair at Weill Cornell Medicine. “It’s very common to test [hospitalized kids] now,” but was less common early in the pandemic. Some of those kids test positive, even if it’s not clear that they were hospitalized for COVID in the first place.”You find them much more frequently at a time that there’s a surge,” says Permar. The Discovery Health report notes that those ‘incidental’ cases could be contributing to the apparent risk as well.
It could turn out that Omicron tends to cause milder disease, even in people with no prior immunity.
“I think that there is more data beginning to suggest that this reduced virulence may in fact hold true across more global regions BUT we’re waiting for data to substantiate that,” says Jason Kindrachuk, a virologist at the University of Manitoba who has written on COVID’s pathogenicity, in an email to Popular Science. “And the crux of all of this is that the transmissibility and movement of Omicron through global populations is outpacing our ability to acquire enough data to answer this question.”
At a briefing on December 10, University of the Witwatersrand infectious disease researcher Anna von Gottberg presented a similar finding. The data relied on the fact that Omicron gives a telltale reading on some PCR tests, allowing researchers to estimate its presence even without sequencing cases. During the November spike in Omicron cases, but before it pushed out other variants, von Gottberg said that Omicron-suspected cases were less likely to lead to hospitalization. There are “some hints that maybe the disease is less severe, but we need to wait several weeks,” she said. It could be that Omicron was simply infecting a lot of people who were resistant to other variants, and have some immunity.
Why exactly fewer people are getting very sick from Omicron doesn’t matter so much for understanding its impacts. A mild variant, whether via immunity or intrinsic qualities, still poses profound challenges.
“I would say that everything so far has been reassuring to say this is not a virus that is scarier than the first, in terms of how sick it makes people,” says Permar. “Whereas two years ago we were overwhelmed with sick people needing ventilators… now it’s going to be complicating our staffing.” COVID positive healthcare providers can’t work. Meanwhile, hospitalizations in the United States are rising because of Delta. There are national nursing shortages, driven by burnout and pay issues after two years of managing a crisis.
Staffing shortages are “a nice outcome” relative to ventilator shortages, says Permar. But it’s an outcome that raises deep questions about the capacity of the American healthcare system.
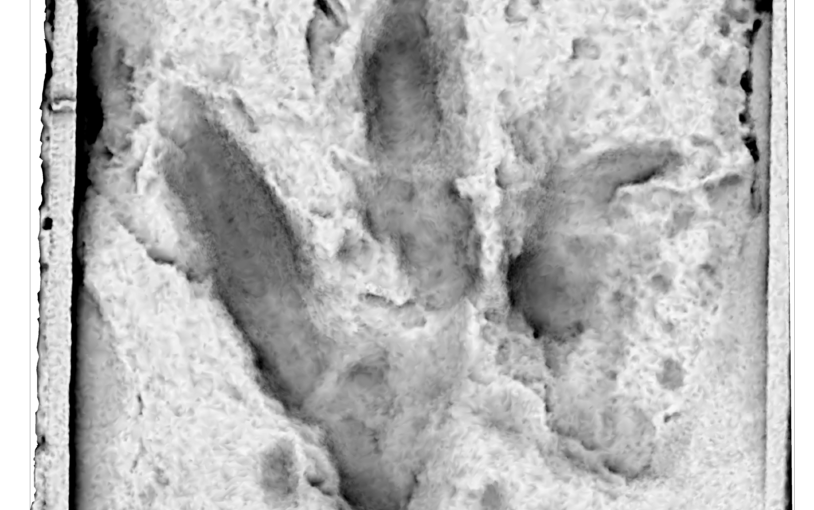
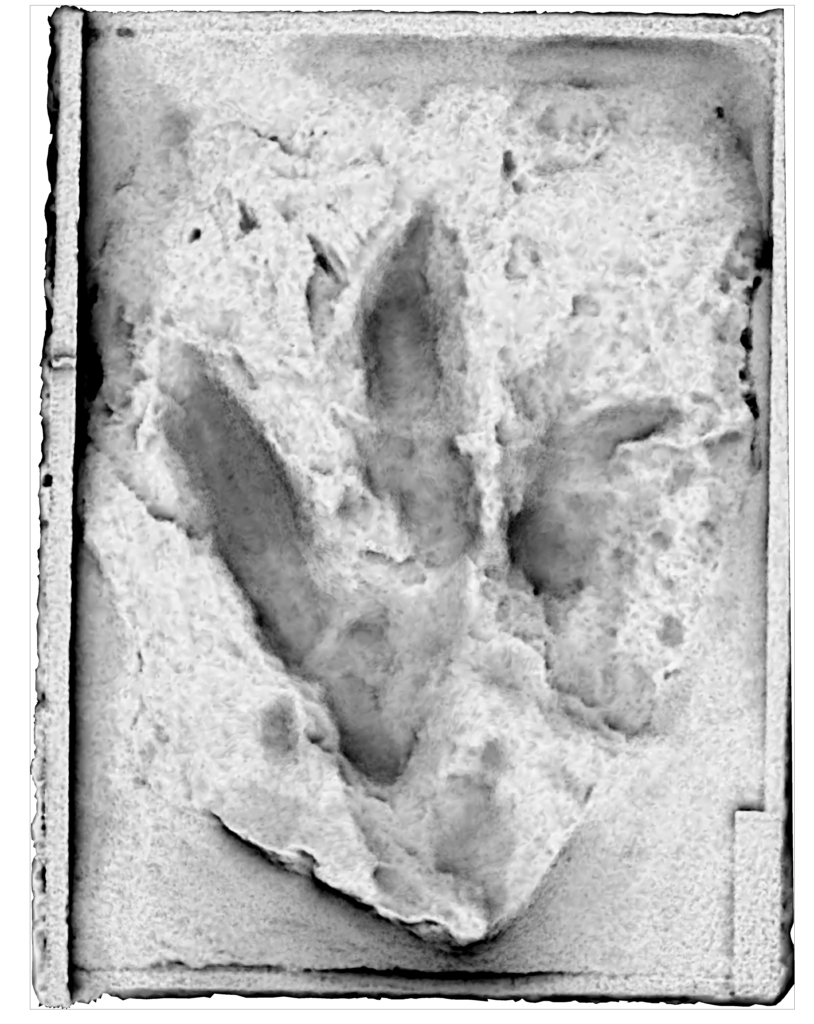
In the 1960s, Australian coal miners stumbled across huge, bird-life footprints protruding from the ceiling of their subterranean work site in south-eastern Queensland. The marks, more than a foot long, belonged to a creature that trekked across swampy land around 250 million years ago. They sent paleontologists into a tizzy, who though the tracks belonged to a carnivorous dinosaur—a creature larger than any other predator of its time.
Some fossil experts across the globe had their doubts about the footprints coming from a predator, though. But they couldn’t quite disprove the carnivore idea because all they had access to was black and white photos and a drawing of the tracks. With 3D modeling technology today, researchers have been able to analyze the impressions further, and identify the mysterious creature as an herbivore from the group Prosauropoda.
“We can now make 3D models, 3D visualizations, and augmented reality so that we can get not only a clearer and more detailed understanding of the fossil that we’re examining, but also communicate that in a more complete manner,” says Anthony Romilio, paleontologist at University of Queensland and lead author on the new study published in Historical Biology.He and his team used casts of one of the prints, made by geologists and the Queensland Museum back in 1964, to create a 3D model of the dinosaur’s foot to better understand it’s entire body.
Once the track was digitized, the researchers took exact measurements from the cast and verified them with the 3D model. Back in the ‘60s, scientists had to pull estimates from the single drawing and photos; their estimates put the the print as several centimeters longer than its actual length. Without certainty of the size of the print, it’s difficult to gauge the true nature of a long-extinct dinosaur.
The new study was made possible by a cast of one of the original footprints. Courtesy of Anthony Romilio Anthony Romilio
Using the updated dimensions, and his colleagues multiplied the length of the dinosaur’s foot by a factor of four, which gave them the rough length of the leg up the hip joint. Smaller feet mean smaller legs, helping to create a picture of the entire dinosaur that indicated it was not a predator.
Even before he knew the proper size of the creature’s feet, however, Romilio had doubts about its supposed predatory behavior. Had it been a carnivore, it would have been the biggest predator of the Triassic period—which explains all the hubbub around the discovery decades ago. But other fossil finds show that dinosaurs of the previously estimated size didn’t turn up until millions of years later during the Jurassic period.
By distilling a 3D model of the track, Romilio and his team were able to make the original discovery more accessible to paleontologists across the world. Romilio also created an augmented reality visual of the dinosaur and its footprints, so that everyone, not just researchers, could see this creature on their iPhones and iPads.
Dr Anthony RomilioUse these QR codes on the Apple app Adobe Aero to experience the dinosaur in augmented reality. Courtesy of Anthony Romilio Dr Anthony Romilio
“This allowed a more comprehensive discussion about these footprints,” says Hendrick Klein, an expert on Triassic dinosaurs at the Saurierwelt Paläontologisches Museum in Germany. Romilio reached out to him for a second opinion after the study team realized the exact measurement of the foot came from a dinosaur that was smaller than imagined. Once Klein was involved, he corroborated the idea by looking at the Australian tracks against that of other Triassic herbivores.
“I remember that I had excavated footprints in North America, and had also seen similar footprints in Italy,” Klein says. “I compared Anthony’s results with these footprints, and what I distinctly saw was that they share similar morphology.”
One particular feature Klein noted was the rotation of the print. The track is directed strongly towards the midline of this creature’s foot, indicating that the dinosaur’s steps rotate inwards, a feature that isn’t typically seen among predatory dinosaurs.
Klein and Anthony both stress that prehistoric footprints are vital to understanding the fossil record. No one has identified skeletal dinosaur remains from the Triassic period in Australia yet, so researchers only have these small indications of life to better understand the continent’s past. They just have to get the math right; 3D tech will help.
Since its formation in 1983, Kīlauea’s Pu‘u‘ō‘ō cone had risen and fallen as magma fluctuated throughout the volcano’s vibrant East Rift Zone. But on April 30, 2018, Pu‘u‘ō‘ō announced its retirement with a rumble. The once-brimming basin drained down into the earth like an unclogged sink. Newly liberated lava crept from the summit toward the Big Island’s eastern tip. Soon Leilani Estates, a community of around 2,000, would confront the eruption firsthand. Fissures exploded with ash, noxious gas, and molten lava across roads and into backyards. Pu‘u‘ō‘ō’s swan song ultimately destroyed some 700 homes.
[embedded content]
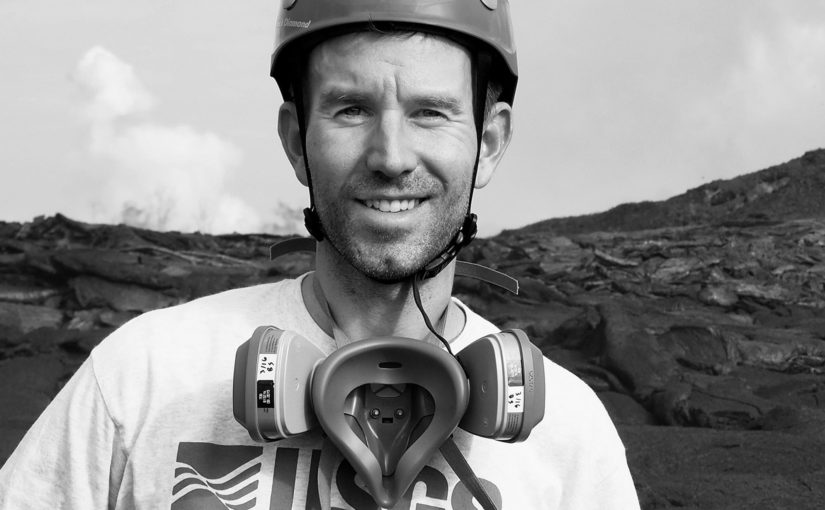
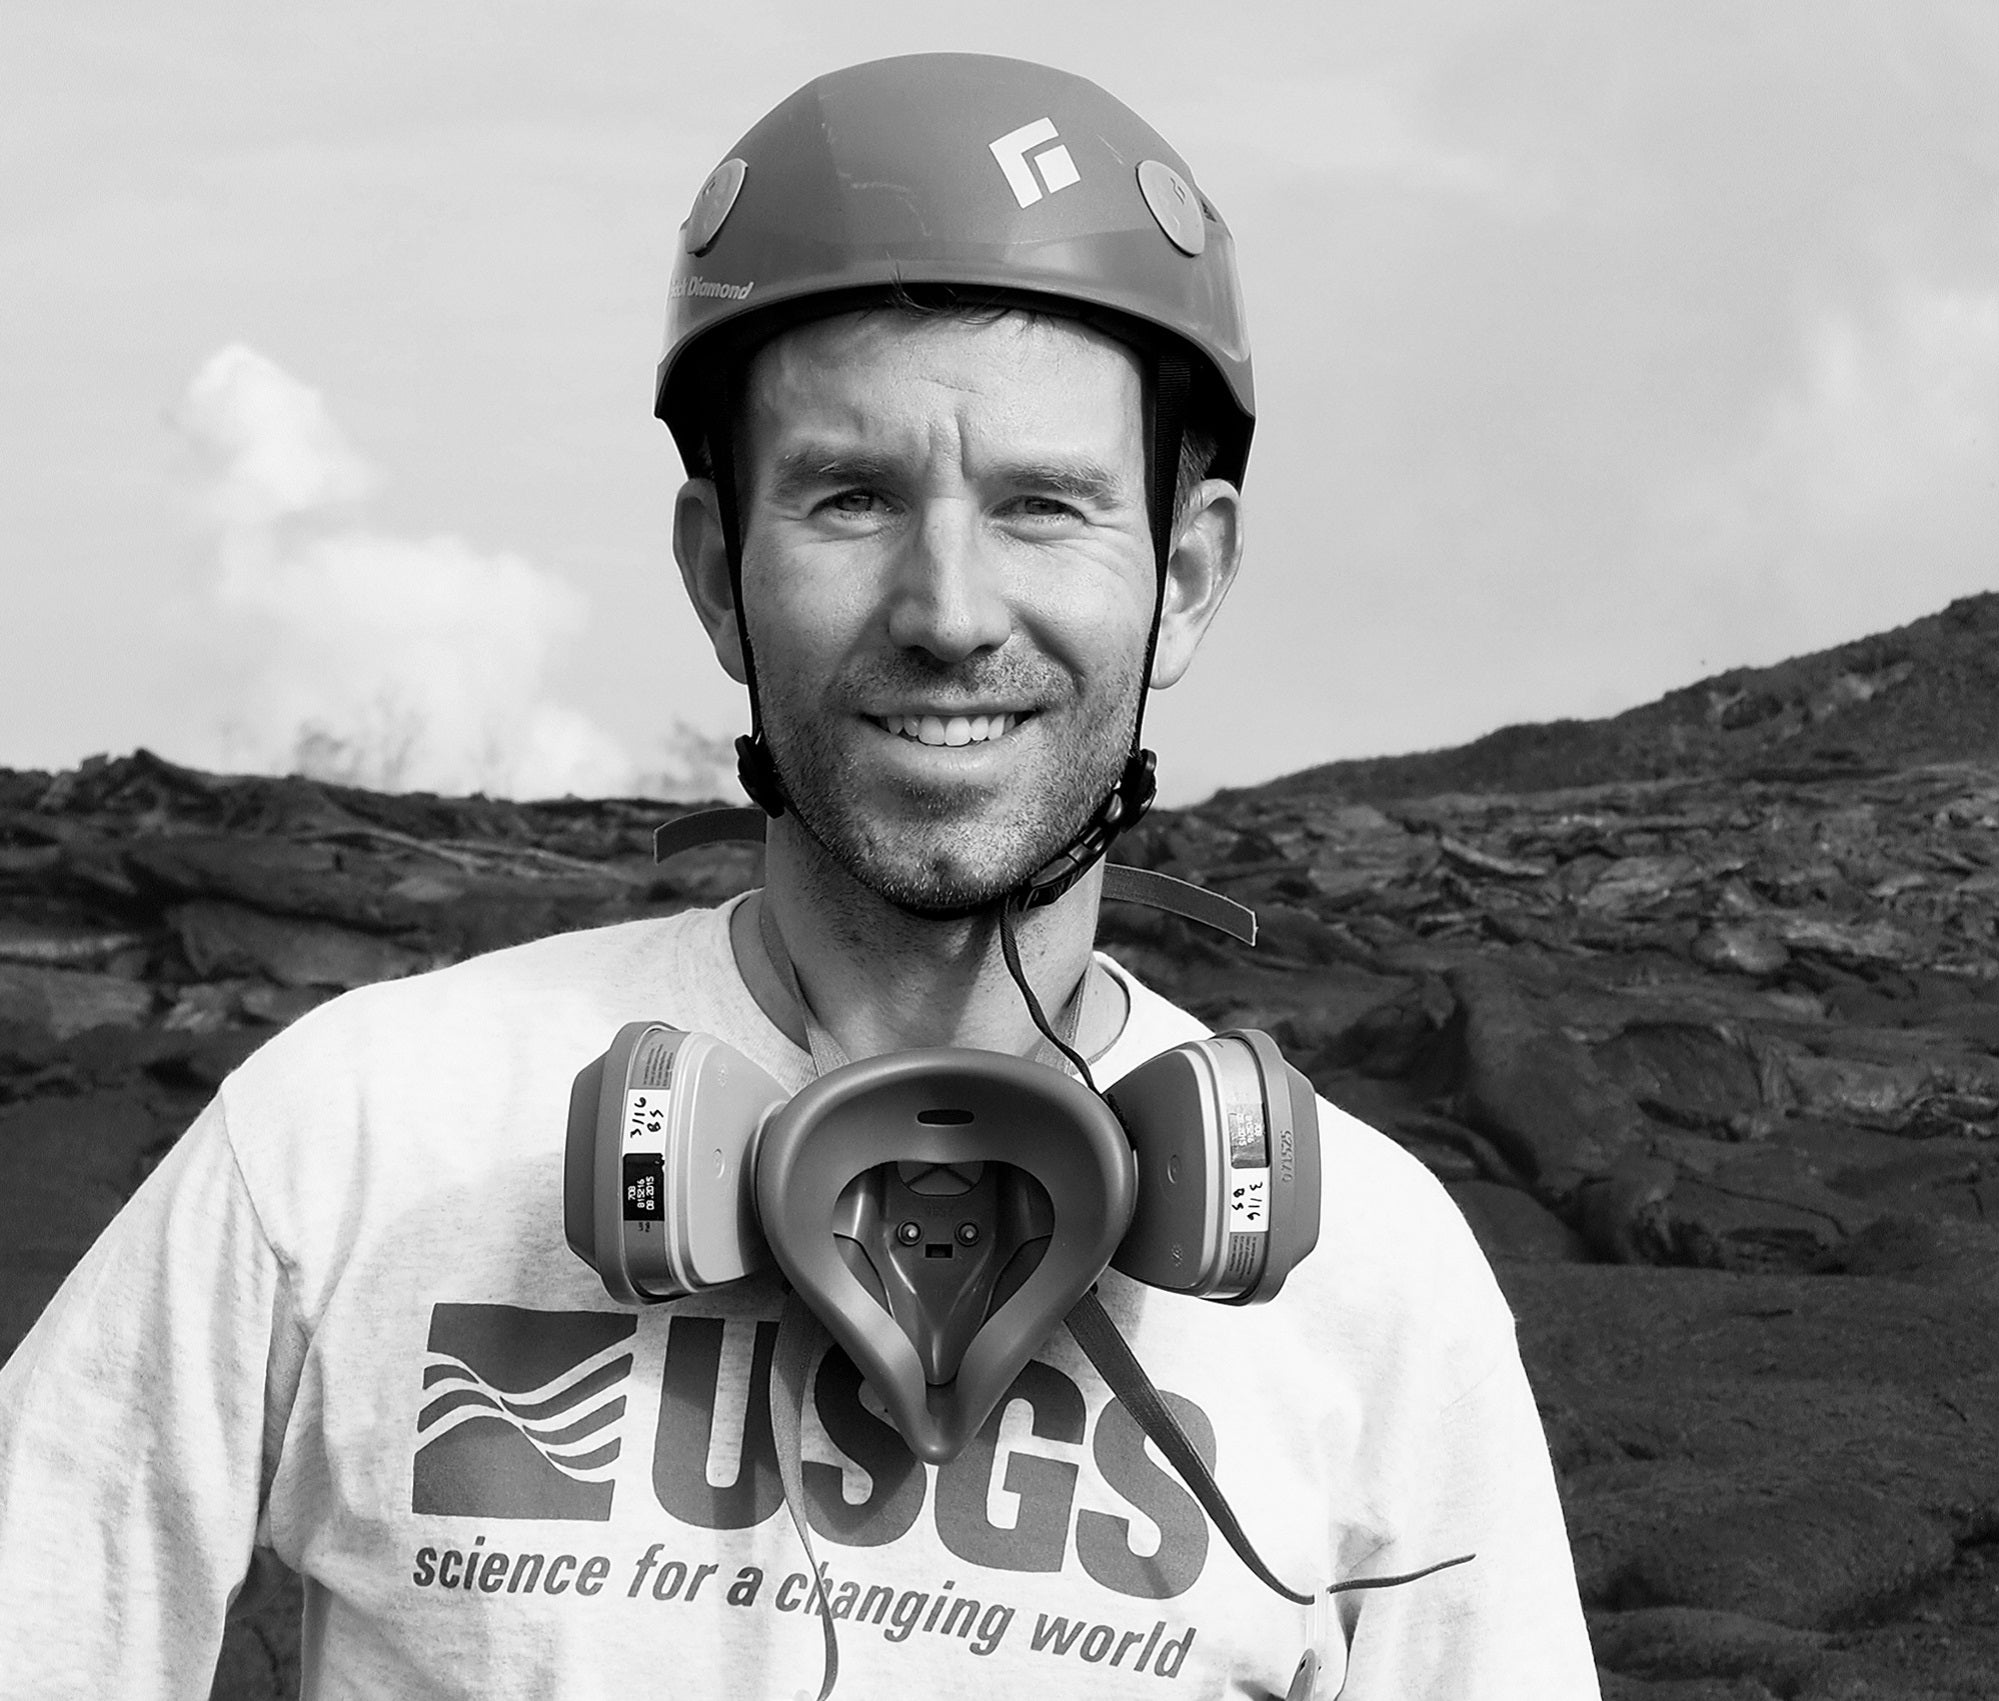
Then the foundation of the Hawaiian Volcano Observatory (HVO)—established by the US Geological Survey (USGS) in 1912—began to crack. On May 16 the staff was forced to evacuate. “We scattered to the winds and took what we could carry,” recalls Brian Shiro, who was then a geophysicist at the site. Shiro has always had a front-row seat in the rapidly changing field of hazard monitoring, but Kilauea presented the unique challenge of extracting real-time data from an uncontrollable force of nature. It taught him lessons he now applies to monitoring earthquakes as deputy director of the USGS Geologic Hazards Science Center in Golden, Colorado.
Shiro, who began his career as a tsunami researcher, settled in Hawaii in 2005. After a stint with the National Oceanic and Atmospheric Administration, he joined HVO in 2016 to apply his knowledge of seismic hazard monitoring to the complex world of volcanology. “These volcanoes are living, breathing things, and it’s exciting to have your finger on the pulse of the Earth,” he says.
As the 2018 cataclysm shook their facilities, Shiro and his colleagues engaged a remote monitoring system of GPS and seismic stations, cameras, drones, and other sensors to gather info. Dozens of devices were lost, damaged, or destroyed. Ash blanketed the solar charging panels of UV spectrometers meant to measure gas, rendering them inoperable for months.
Thankfully, the observatory had prepared for such obstacles years prior. “All of our stations talked to each other in a way that was easily configurable, allowing us to reroute a signal from one site to another without having to go there,” Shiro says. Throughout the eruption—which officially ended on September 5, 2018—he and USGS colleagues collaborated with emergency managers and public safety authorities and worked around the clock, publishing updates that empowered residents to plan their lives around a volcano’s whims.
Despite their efforts, the effects of the eruption were widespread. Federal and county officials found that road repair costs would reach $82 million; local farmers suffered some $28 million in collective damages; and communities lost up to $94 million in tourism that year. Still, the work of HVO staff and other responders meant that no one died.
The event taught the USGS team how to handle a rapidly evolving crisis while simultaneously disseminating critical information to those affected, which Shiro believes will assist them in future eruption response efforts. Now, at the Geologic Hazards Science Center, he manages a group of scientists who keep tabs on earthquake hazards. Their work is central to populating the USGS website earthquake.gov, which publishes current data to, in part, educate the public and reduce the potential for harm when the ground trembles. “It’s a new hazard for me, having come from tsunamis and then volcanoes,” says Shiro. “I’m checking off different hazards here.”
Tom Langen is a professor of Biology at Clarkson University. This story originally featured on The Conversation.
Autumn is here, and that means the risk of hitting deer on rural roads and highways is rising, especially around dusk and during a full moon.
Deer cause over 1 million motor vehicle accidents in the US each year, resulting in more than $1 billion in property damage, about 200 human deaths and 29,000 serious injuries. Property damage insurance claims average around $2,600 per accident, and the overall average cost, including severe injuries or death, is over $6,000.
While avoiding deer—as well as moose, elk and other hoofed animals, known as ungulates—can seem impossible if you’re driving in rural areas, there are certain times and places that are most hazardous, and so warrant extra caution.
Transportation agencies, working with scientists, have been developing ways to predict where deer and other ungulates enter roads so they can post warning signs or install fencing or wildlife passages under or over the roadway. Just as important is knowing when these accidents occur.
My former students Victor Colino-Rabanal, Nimanthi Abeyrathna, and I have analyzed over 86,000 deer-vehicle collisions involving white-tailed deer in New York state using police records over a three-year period. Here’s what our research and other studies show about timing and risk.
Time of day, month and year matters
The risk of hitting a deer varies by time of day, day of the week, the monthly lunar cycle and seasons of the year.
These accident cycles are partly a function of driver behavior—they are highest when traffic is heavy, drivers are least alert and driving conditions are poorest for spotting animals. They are also affected by deer behavior. Not infrequently, deer-vehicle accidents involve multiple vehicles, as startled drivers swerve to miss a deer and collide with a vehicle in another lane, or they slam on the breaks and are rear-ended by the vehicle behind.
In analyzing thousands of deer-vehicle collisions, we found that these accidents occur most frequently at dusk and dawn, when deer are most active and drivers’ ability to spot them is poorest. Only about 20 percent of accidents occur during daylight hours. Deer-vehicle accidents are eight times more frequent per hour of dusk than daylight, and four times more frequent at dusk than after nightfall.
During the week, accidents occur most frequently on days that have the most drivers on the road at dawn or dusk, so they are associated with work commuter driving patterns and social factors such as Friday “date night” traffic.
Over the span of a month, the most deer-vehicle accidents occur during the full moon, and at the time of night that the moon is brightest. Deer move greater distances from cover and are more likely to enter roadways when there is more illumination at night. The pattern holds for deer and other ungulates in both North America and Europe.
Over a year, by far the highest numbers of deer-vehicle accidents are in autumn, and particularly during the rut, when bucks search and compete to mate with does. In New York state, the peak number of deer-vehicle accidents occurs in the last week of October and first weeks of November. There are over four times as many deer-vehicle accidents during that period than during spring. Moose-vehicle accidents show a similar pattern.
That high-risk period is also when daylight saving time ends—it happens on Nov. 7, 2021, in the US. Shifting the clock one hour back means more commuters are on the road during the high-risk dusk hours. The result is more cars driving at the peak time of day and during the peak time of the year for deer-vehicle accidents.
Overall, given that most US states and more than 70 countries have seasonal “daylight saving” clock shifts, elevated ungulate-vehicle accident rates caused by clock shift may be a widespread problem.
It’s important to remember that deer-vehicle accidents can occur at any time of day or night, on any day of the year—and that deer can show up in urban areas as well as rural ones.
The insurance company State Farm found that on average, US drivers have a 1 in 116 chance of hitting an animal, with much higher rates in states such as West Virginia, Montana and Pennsylvania. Over the 12 months ending in June 2020, State Farm counted 1.9 million insurance claims for collisions with wildlife nationwide. Around 90 percent of those involved deer.
Where deer or other ungulates are likely to be present, drivers should always be alert and cautious, especially at dawn, dusk, on bright moonlit nights and during the fall rut.
For GREAT deals on a new or used Toyota check out Claremont Toyota TODAY!